Figure 6.
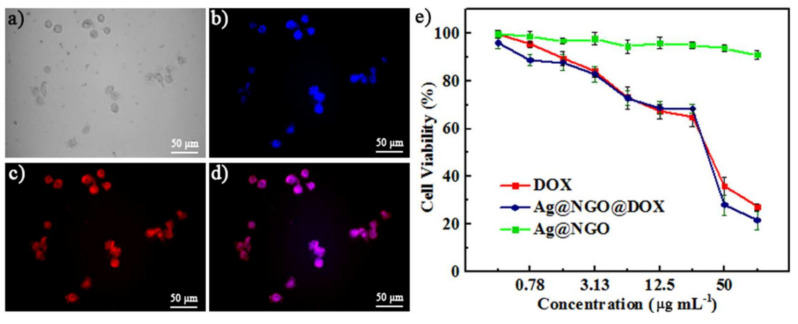
Fluorescence microscopy images of cancer cells HepG-2 after incubation with Ag-NGO-DOX (12.5 µg/mL): (a) bright field; (b) blue emission (λex = 360 nm ± 20 nm) of the cell nucleus after staining with 4′,6-diamidino-2-phenylindole (DAPI); (c) red fluorescence emission of DOX inside the cells, by excitation at λex = 490 ± 20 nm; (d) overlapping of (b,c), showing that DOX reached the cancer cells’ nucleus; (e) MTT assay viability results of HepG-2 liver cancer cells after incubation with different concentrations (0, 0.78, 1.56, 3.13, 6.25, 12.5, 25, 50, and 100 µg/mL) of free DOX, Ag-NGO, and Ag-NGO-DOX. Reproduced from [74], with permission from American Chemical Society, 2018.

