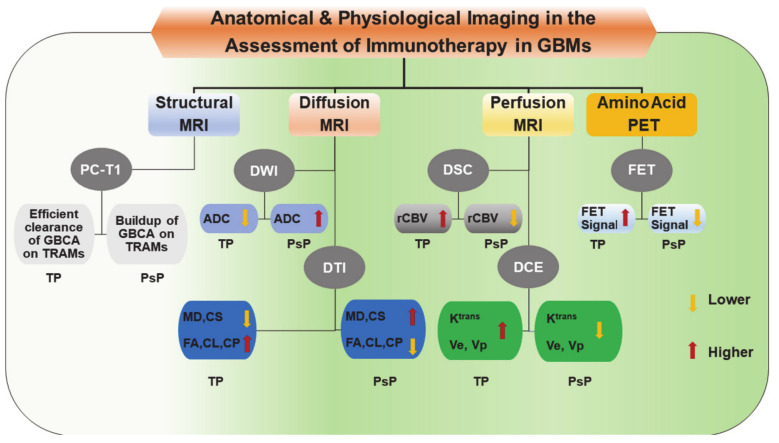
Figure 5.
A block diagram is showing trends in structural, and physiologic imaging parameters that are usually observed in distinguishing true progression (TP) from pseudoprogression (PsP) in GBMs following treatment with immunotherapy. ADC, Apparent diffusion coefficient; CL, Coefficient of linear anisotropy; CP, Coefficient of planar anisotropy; CS, Coefficient of spherical anisotropy; DCE, Dynamic contrast-enhanced; DSC, Dynamic susceptibility contrast; DTI, Diffusion tensor imaging; DWI, Diffusion weighted imaging; FA, Fractional anisotropy; FET, O-(2-[18F] fluoroethyl)-L-tyrosine; GBCA, gadolinium-based contrast agent; GBM, Glioblastoma; Ktrans, Volume transfer constant; MD, Mean diffusivity; MRI, Magnetic resonance imaging; PC-T1; Post-contrast T1 weighted images; PET, Positron emission tomography; PsP, Pseudo-progression; rCBV, relative cerebral blood volume; TP, True Progression; TRAM, Treatment response assessment map; Ve, Fraction of extracellular-extravascular space; Vp, Fraction of plasma volume.

