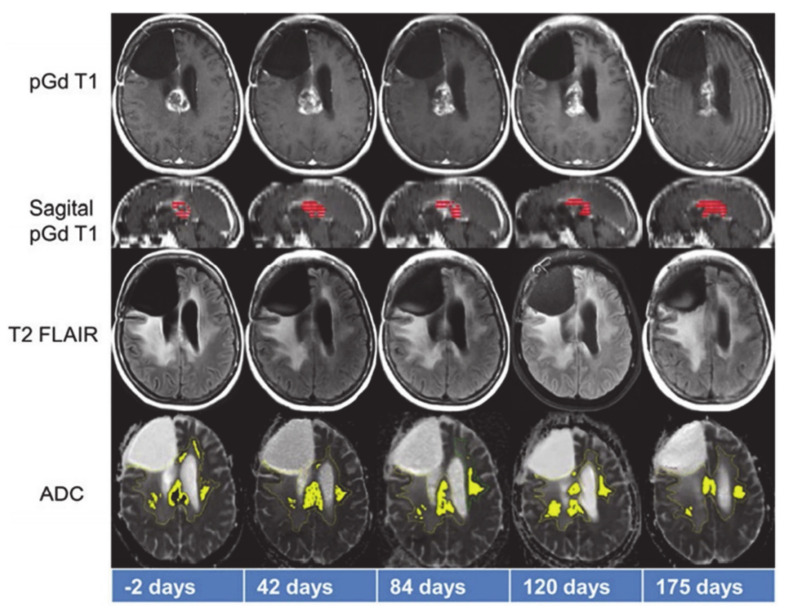
Figure 6.
Representative anatomical images and apparent diffusion coefficient (ADC) maps from a patient who benefitted from treatment with anti-PD1 immunotherapy. While tumor volume on sagittal post-contrast T1 weighted images (red color) demonstrated initial declining trends from day 42–84, it increased from day 120–175. On the other hand, tumor volume as measured by considering that ADC values on the ADC maps (yellow color) decreased between day 120–175, indicating positive response. Reprinted with permission from ref. [95]. Copyright 2017 Springer-Verlag Berlin Heidelberg.

