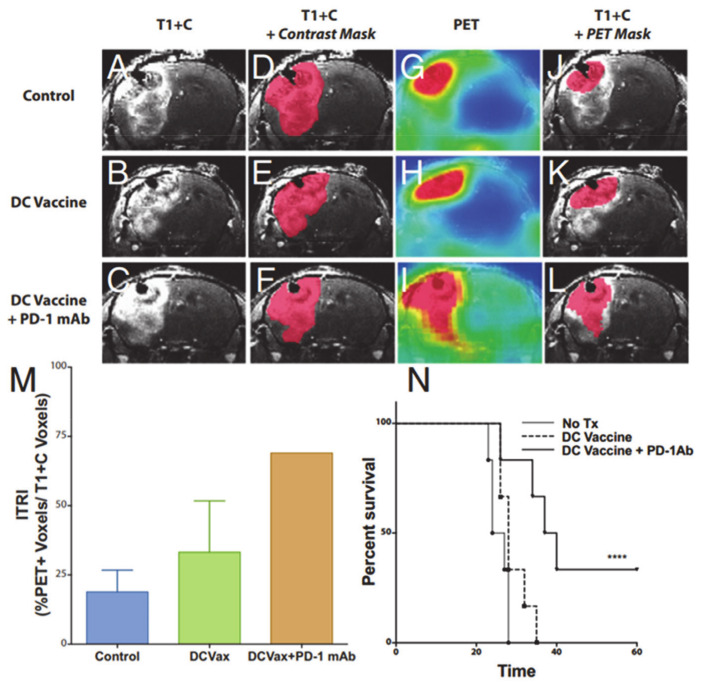
Figure 9.
Representative coronal post-contrast T1 weighted images of untreated control, dendritic cell vaccination (DCVax; Northwest Biotherapeutics)-treated, and DCVax + PD-1 mAb-treated GBM bearing mice (A–C). Representative contrast subtraction maps (red; contrast mask) overlaid onto post-contrast T1 weighted images (D–F). Representative coronal [18F]-FAC PET images of untreated control and DCVax- and DCVax + PD1 mAb-treated mice (G–I). Representative threshold PET subtraction maps (red; PET mask) overlaid onto post-contrast T1 weighted images (J–L). The immunotherapeutic response index (ITRI, a ratio of the PET voxels divided by the T1+C subtraction voxel data) calculated for each treatment group is shown (M). Increased ITRI values were observed in mice treated with DCVax and/or PD-1 mAb compared with untreated mice. Survival plots of intracranial GBM-bearing untreated control (no Tx), DCVax-treated, and DCVax + PD-1 mAb-treated mice (N). Reprinted with permission from ref. [114].

