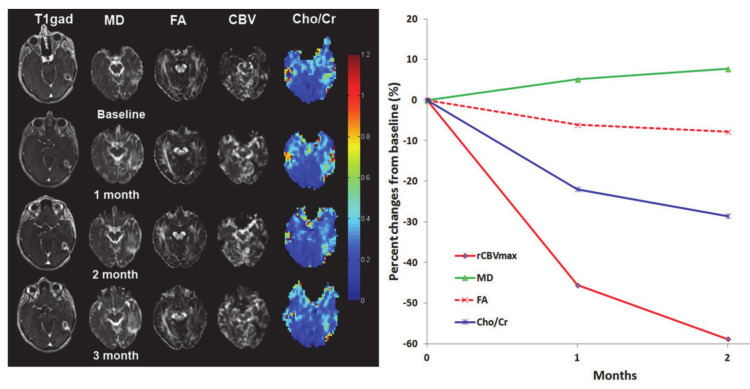
Figure 11.
Representative baseline and follow-up anatomical images and parametric maps at baseline and follow-up periods from a patient treated with epidermal growth factor receptor deletion mutation (anti-EGFRvIII) chimeric antigen receptor T cell therapy. Percentage changes in parameters from baseline to 1-, and 2-month follow-up periods from this patient are shown. Reprinted with permission from ref. [115]. Copyright 2019 Springer Nature.

