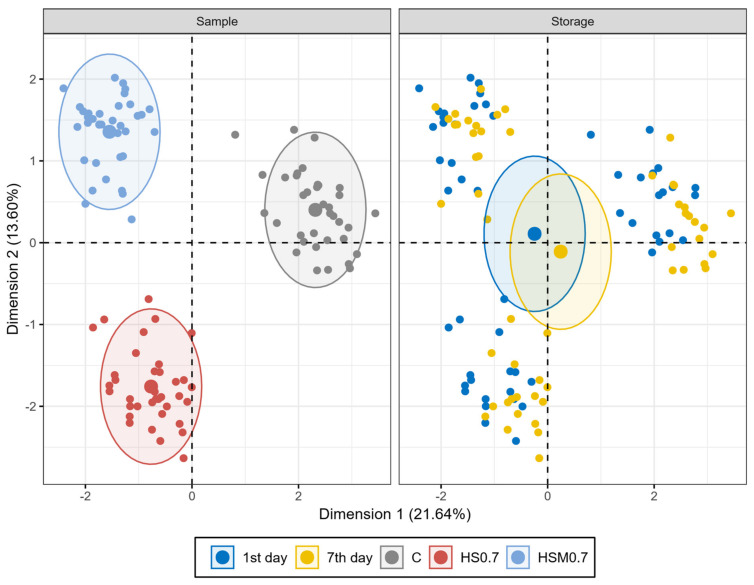
Figure 2.
Multiple factor analysis (MFA) plot of breast meat samples: Combined graph of individuals with visualised sample and storage factor. C: control group; HS0.7: broilers’ diet supplemented with 0.7% of dietary natural HS; and HSA0.7: broilers’ diet supplemented with 0.7% of HS acidified with formic acid.

