Figure 2.
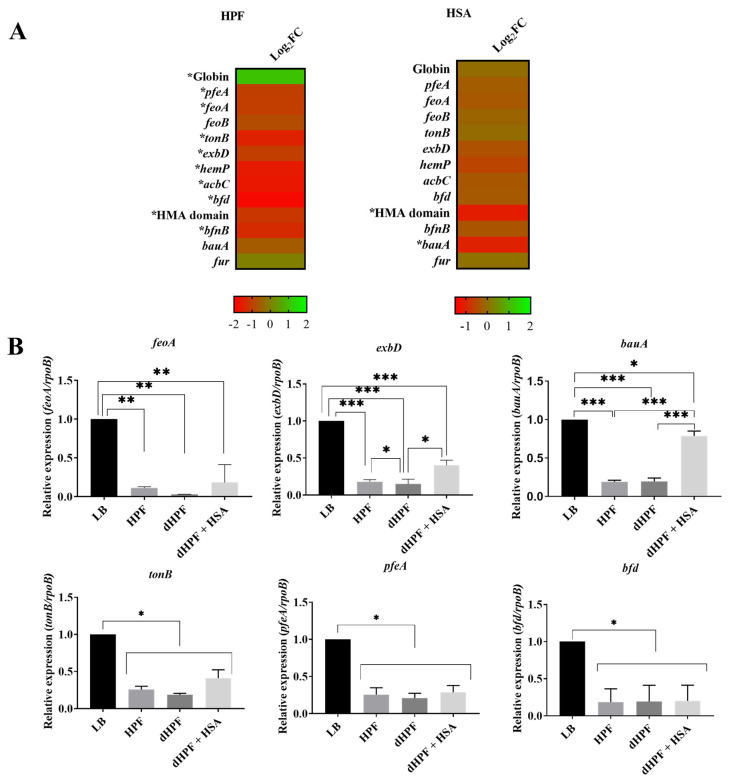
Phenotypic and genetic analysis of iron uptake genes. (A) Heatmap outlining the differential expression of genes (DEGs) associated with iron uptake in presence of HPF or HSA. The majority of iron uptake associated genes are down-regulated (red) in the presence of HPF and HSA. The asterisks represent the DEGs (adjusted p-value < 0.05 with log2fold change >1). (B) qRT-PCR of AB5075 strain genes associated with iron uptake, feoA, exbD, bauA, tonB, pfeA and bfd expressed in LB or LB supplemented with HPF, dHPF, or dHPF + HSA. Fold changes were calculated using double ΔCt analysis. At least three independent samples were used, and four technical replicates were performed from each sample. The LB condition was used as reference. Statistical significance (p < 0.05) was determined by ANOVA followed by Tukey’s multiple-comparison test, one asterisks: p < 0.05; two asterisks: p < 0.01 and three asterisks: p < 0.001.

