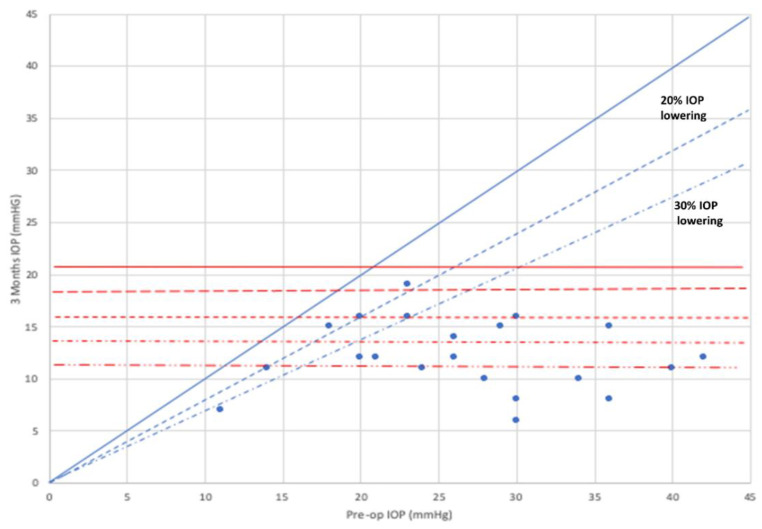
Figure 2.
Scatter plot of the intraocular pressure at baseline and month 3. Mean difference −14.8 ± 6.0 mm Hg, 95 Confidence interval −18.4 to −11.2 mm Hg; p < 0.0001 (two-tailed paired-samples Student t test). The 20% and the 30% lines indicate the level beneath which an IOP reduction of more than 20% or 30%, respectively, compared to baseline value before surgery was reached by the individual cases. IOP: Intraocular pressure.

