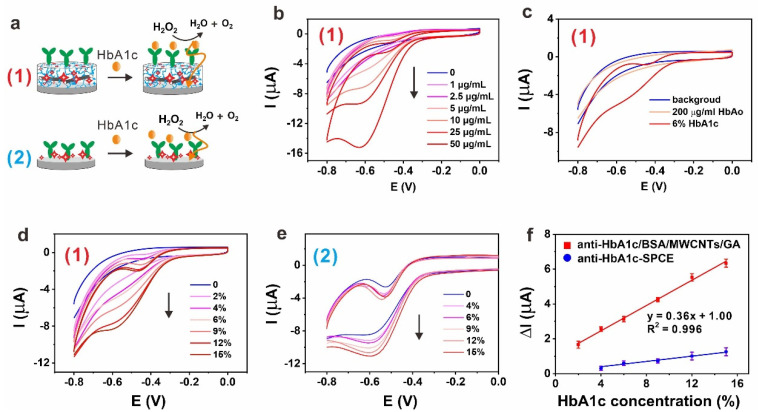
Figure 2.
(a) Schematic illustration of anti-Hb1Ac-BSA/MWCNTs/GA layer (1) and anti-HbA1c layer (2) for selective sensing of HbA1c; (b) CV curves of the anti-HbA1c-BSA/MWCNTs/GA layer in the detection of different concentrations of HbA1c (no HbAo). (n = 3, only one CV plot for each condition is shown); (c) CV curve of the anti-HbA1c-BSA/MWCNTs/GA layer in the detection of HbAo and 6% HbA1c. (n = 3, only one CV plot for each condition is shown); (d) CV curves of the anti-HbA1c-BSA/MWCNTs/GA layer in the detection of different concentrations of % HbA1c (contain HbAo). (n = 3, only one CV plot for each condition is shown); (e) CV curves of the anti-HbA1c layer in the detection of different concentrations of % HbA1c (contain HbAo). (n = 3, only one CV plot for each condition is shown); (f) calibration curves as a function of % HbA1c for anti-HbA1c layer and anti-HbA1c-BSA/MWCNTs/GA layer. (n = 3, error bars represent the standard deviation of the mean).

