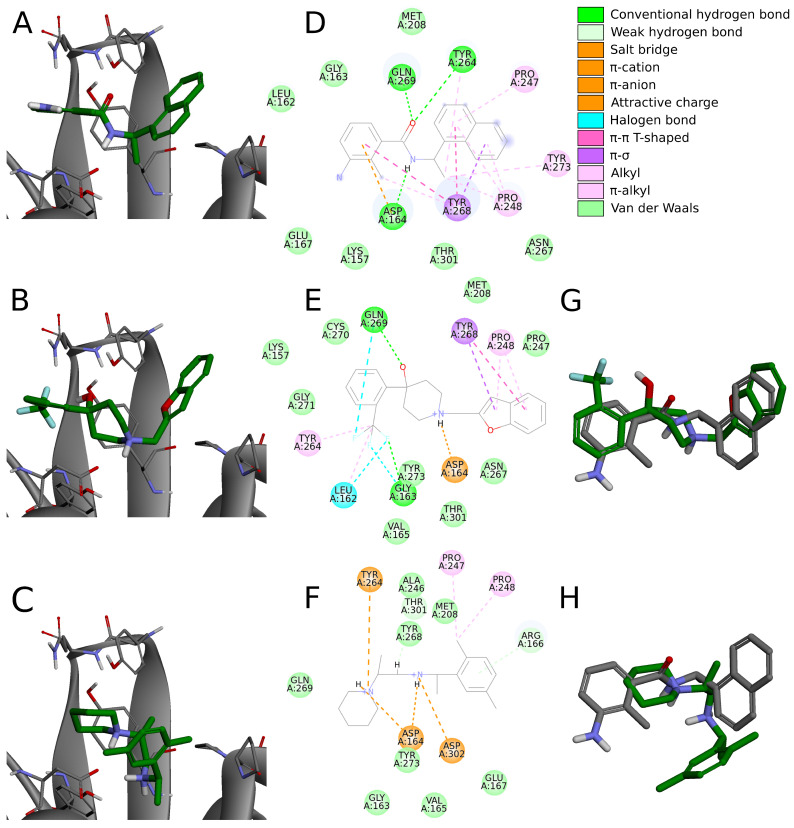
Figure 7.
A comparison of binding modes between the inhibitor from the crystal structure (PDB ID: 7jn2) and potential inhibitors from our screening campaign. Panels (A–C) depict poses of the inhibitor from the crystal structure and potential inhibitors 18 and 3 docked in Discovery Studio to PLpro model based on the aforementioned PDB entry, respectively. Panels (D–F) show interactions these compounds form with the nearby PLpro residues. (G) Binding poses of the inhibitor from crystal structure (gray) and compound 18 (green). (H) Binding poses of the inhibitor from crystal structure (gray) and compound 3 (green). Compound 18, depicted in the middle panels, adopts nearly identical binding pose compared to the crystal inhibitor. Compound 3, shown in the lower panels, binds in a slightly different manner, utilizing more heavily the left part of the molecule instead of the right aromatic ring.

