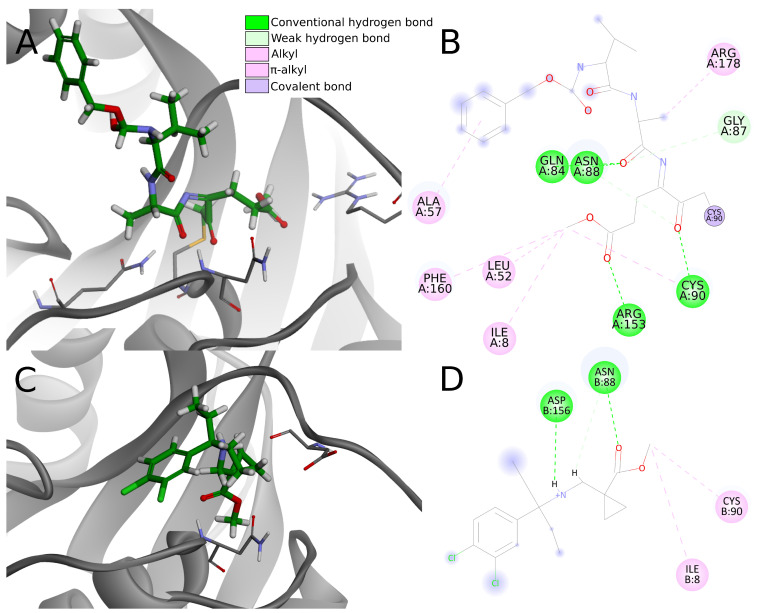
Figure 10.
A comparison of ligand–protein interactions between the crystal structure (PDB ID: 4dm9) and the potential inhibitor from the screening campaign. The upper panels show a 3D view of ligand binding mode (A) and 2D interaction diagram (B) for Z-VAE(OMe)-FMK covalent inhibitor. Panel (C) shows biding mode of compound 9 from screening. In panels (A,C) the residues that create hydrogen bonds with inhibitors were shown in a sticks representation. Panel (D) shows a 2D interaction diagram for potential PLpro inhibitor, compound 9. Chosen compound creates visibly fewer interactions, including hydrogen bonds, than the inhibitor from the crystal structure.

