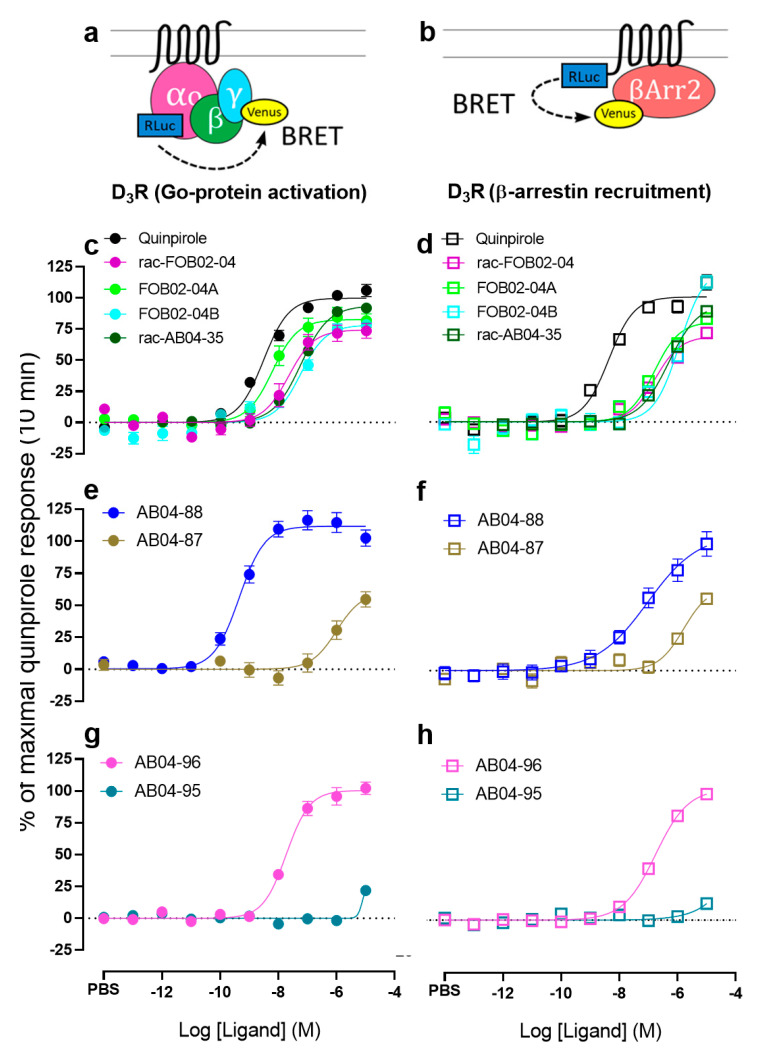
Figure 2.
Pharmacological comparison of D3R bitopic ligands in both G protein activation and β-arrestin recruitment at 10 min. (a). Scheme for the bioluminescence resonance energy transfer (BRET) between Gαo-RLuc and Gγ-Venus. (b). Scheme for the BRET between D3R-RLuc and β-arrestin2-Venus. Concentration-response curves (CRCs) of drug-induced BRET at 10 min between Gαo-RLuc and Gγ-Venus (c,e,g). CRCs of drug-induced BRET at 10 min between D3R-RLuc and β-arrestin2-Venus (d,f,h). CRCs are plotted as percentage of maximal response by quinpirole and presented as means ± SEM of n ≥ 3 independent experiments.

