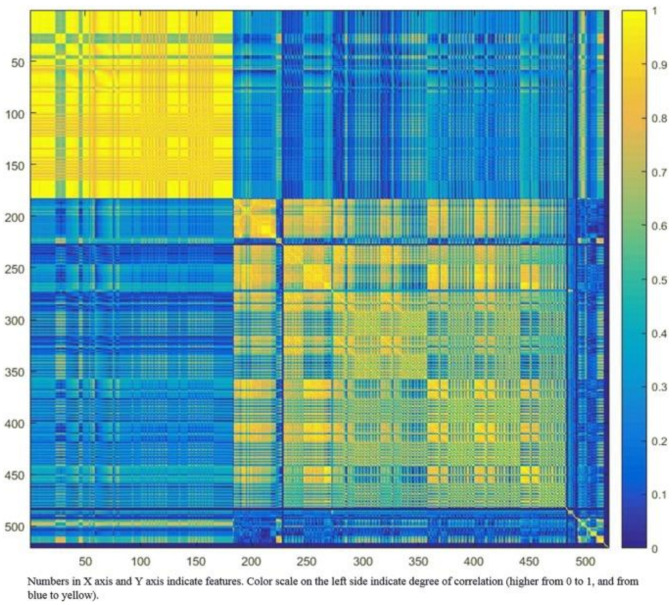
Figure 3.
Graphic representation of radiomic feature clustering. Each radiomic feature was compared with all other features using linear regression analysis. Features were clustered based on the absolute values of the correlation coefficient of the corresponding regression models and plotted along both axes (ranging from 0 to 1 with greater values are shown in yellow with increasing intensity). In this example, the yellow blocks along the diagonal identify the clusters containing the highly correlated radiomic features. The first cluster in the top left corner demonstrated very high redundancy for radiomic features (represented by the high homogeneity of the yellow blocks). The blue blocks visualize the low correlation observed between the radiomic features. Adapted from Rizzo et al. [47].

