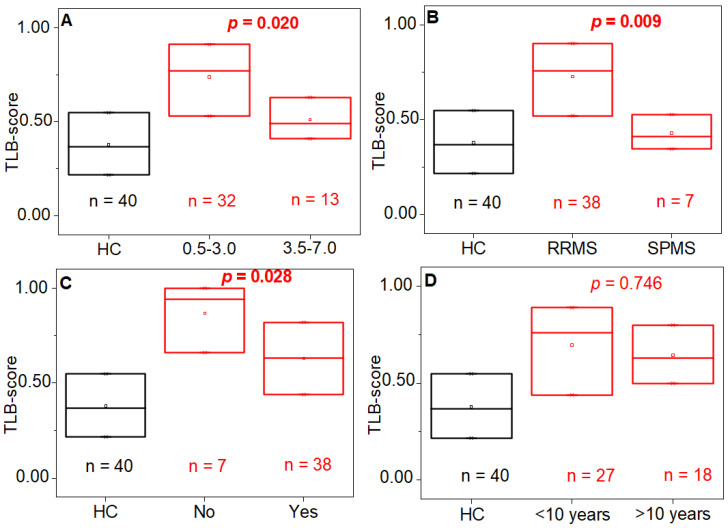
Figure 8.
Distribution of the probability score (TLB score) for healthy individuals (HC group, black) and multiple sclerosis patients (MS group, red) according to (A) level of disability (EDSS = 0.5–3.0: mild disability; EDSS = 3.5–7.0: moderate/severe disability), (B) diagnosis stage (RRMS: early stage; SPMS: advanced stage), (C) pharmacological treatment (no/yes), and (D) disease duration (more or less than 10 years). The p-value (Wilcoxon test) indicates there is a statistically significant difference regarding the level of disability, the diagnosis stage and the therapy in the MS group (p-value < 0.05) but not in the disease duration (p-value > 0.05).

