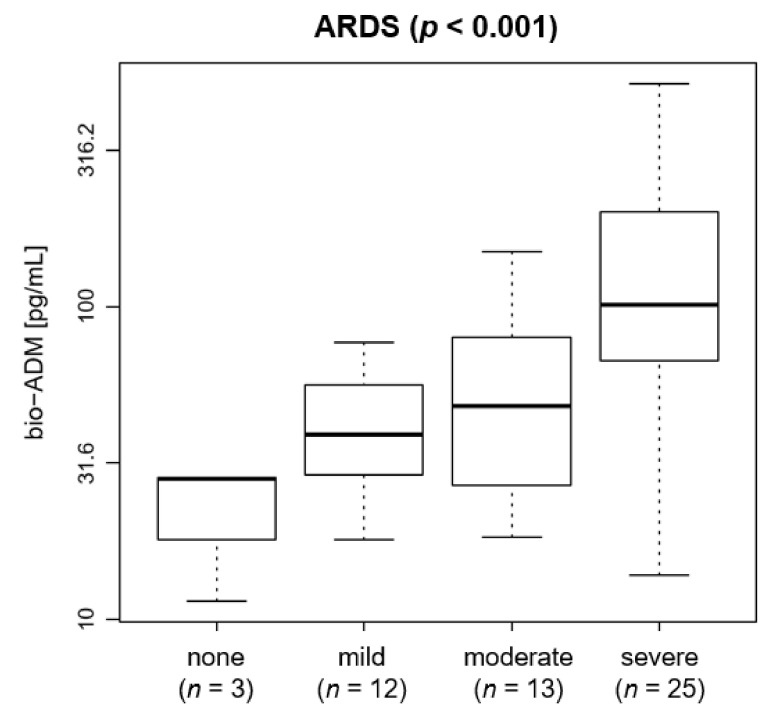
Figure 1.
Boxplot of bio-ADM by ARDS in 53 COVID-19 patients at ICU admission (p < 0.001). The distribution of bio-ADM is shown as boxes, with the lower end of the boxes representing the 25th and the upper end of the boxes representing the 75th percentile (interquartile range), the middle line representing the median, and the whiskers showing the minimal and maximal bio-ADM levels. Horizontal line at 70 pg/mL. The y axis uses a logarithmic scale. ARDS: acute respiratory distress syndrome; bio-ADM: bioactive adrenomedullin; ICU: intensive care unit.

