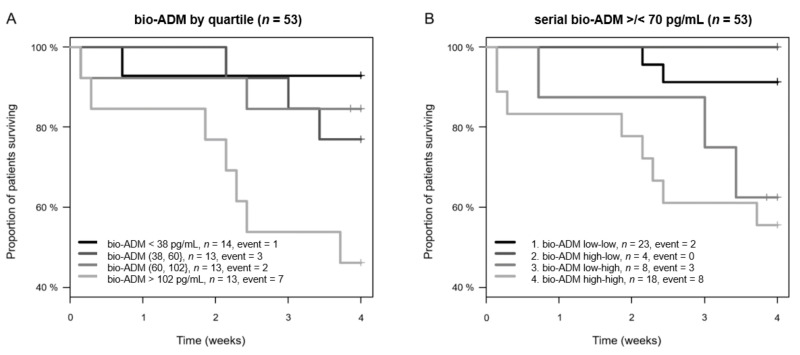
Figure 3.
Kaplan–Meier plot for 28-day mortality for bio-ADM. Curves are plotted by (A) bio-ADM quartiles (for continuous bio-ADM) and (B) to illustrate the potential value of serial measurements of bio-ADM, by > or <70 pg/mL at admission and 48 h (p = 0.122). Patients with missing bio-ADM data at 48 h remain in their initial category. bio-ADM: bioactive adrenomedullin.

