Figure 2.
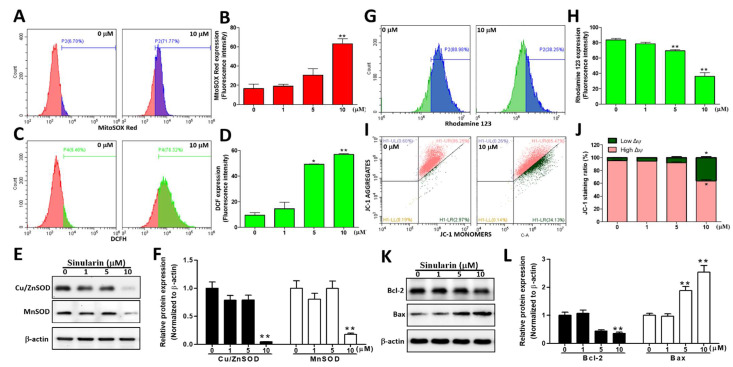
Sinularin induced the mitochondrial O2– and intracellular ROS production, the loss of mitochondrial membrane potential, and expression of relevant proteins in SK-HEP-1 cells. (A) The fluorescence intensity of mitochondrial O2–, measured using MitoSOXTM Red under 0 or 10 µM of sinularin for 24 h. (B) Quantification of O2– accumulation in the mitochondria through analyzing the gated range of single-parameter histograms from 5 × 10³–106. (C) The fluorescence intensity of intracellular ROS, measured using CM-H2DCFDA under 0 or 10 µM of sinularin for 24 h. (D) Quantification of DCF (2′,7′-dichlorofluorescein) signals from the intracellular ROS level via analyzing the gated range of single-parameter histograms from 5 × 10³–106. (E) SK-HEP-1 cells treated with different concentrations of sinularin for 24 h. The cell lysates were subjected to Western blot analysis of the bands of Cu/ZnSOD, MnSOD, and the internal control β-actin. Full, uncropped Western blot gels are shown in Supplementary Figure S2B. (F) Cu/ZnSOD and MnSOD protein levels, quantified by densitometry analysis using ImageJ software after being normalized with the β-actin level. (G) SK-HEP-1 cells treated with and without 10 μM of sinularin for 24 h. ΔΨ depolarization effects were detected using cell-permeable cationic Rhodamine 123 and flow cytometry. (H) Quantification of Rhodamine 123 signals. The quantitative values were obtained after analyzing the gated range of single-parameter histograms from 2 × 10⁶–107. (I) SK-HEP-1 cells were treated with and without 10 μM of sinularin for 24 h. ΔΨ depolarization effects were detected using cell-permeable cationic JC-1 and flow cytometry, and mitochondrial depolarization was indicated by a decrease in the red fluorescence signal. (J) Quantification of JC-1 signals. The quantitative values were obtained after analyzing the gated range of the quadrant plot from high ΔΨ (upper right) and low ΔΨ (lower right). (K) Western blot analysis with antibodies against Bcl-2, Bax, and the internal control β-actin. Full, uncropped Western blot gels are shown in Supplementary Figure S2C. (L) Bcl-2 and Bax protein levels, quantified by densitometry analysis using ImageJ software after being normalized with the β-actin level. Each bar represents the mean ± SE of three independent experiments. The results were analyzed using Student’s t-test to determine the significance, in which * p < 0.05 and ** p < 0.01 relative to the control (sinularin-untreated cells).

