Figure 4.
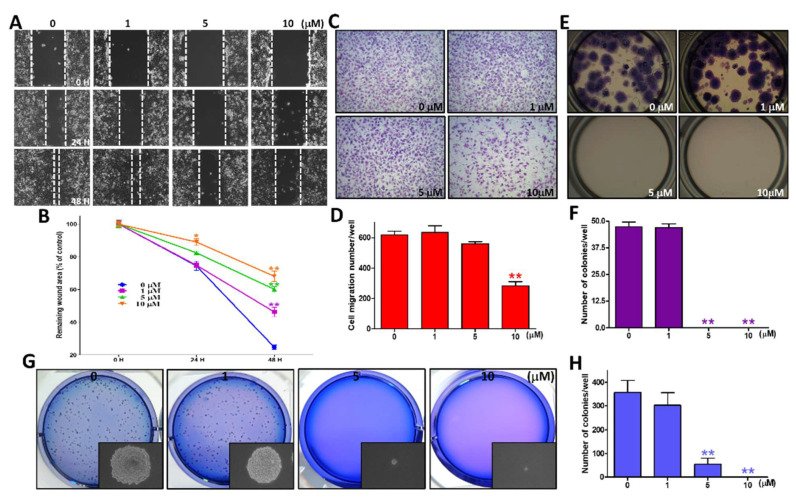
The effects of various concentrations of sinularin treatment on wound healing, cell migration, and colony formation of SK-HEP-1 cells. (A) The cells were scratched and treated with 0, 1, 5, and 10 μM of sinularin for 0, 24, and 48 h, and then photographed by phase-contrast microscopy at 100× magnification. (B) Statistics of the wound areas (blank indicates no cells) in the scratch-test assay, quantified using ImageJ software after being normalized with the time point 0 h at different concentrations of sinularin. (C) The profile of migration cells treated with 0, 1, 5, and 10 μM of sinularin for 4 h before being evaluated for chemotactic potency, captured by phase-contrast microscopy at 100× magnifications. (D) Quantification of the migration cell count using PhotoCapt software. (E) Colony formation morphology of attached cells. The cells were added to different concentrations of sinularin and incubated for 10 days, followed by fixation with 100% methanol and staining with 10% Giemsa stain. (F) Quantification of the number of colonies. (G) The soft agar colony formation assay was used to analyze the non-adherent growth ability of SK-HEP-1 cells after 14 days of co-culture with different concentrations of sinularin. A phase-contrast inverted microscope was used to photograph the pattern of cell colonies before staining, as shown in the under right corner of the frame. After staining with Giemsa stain, a digital camera was used to photograph the SK-HEP-1 colonies. (H) Quantification of the number of soft agar colonies. Each bar represents the mean ± SE of three independent experiments. The results were analyzed using Student’s t-test to determine the significance, in which * p < 0.05 and ** p < 0.01, relative to the control (sinularin-untreated cells).

