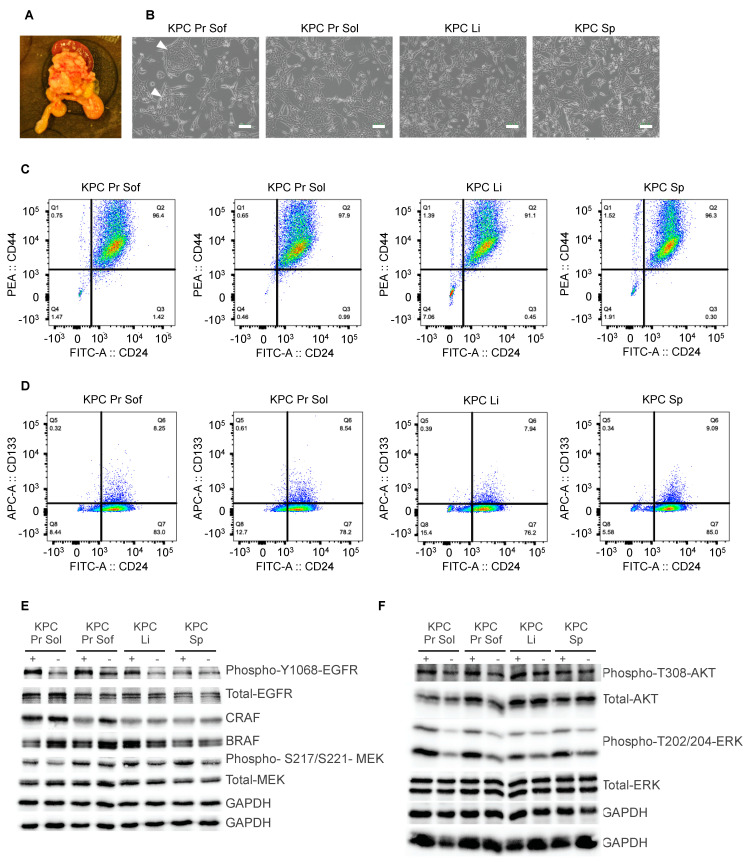
Figure 2.
Establishing a KrasG12D-driven mouse model of metastatic PDAC. (A). Picture of primary tumor and spleen from which the cell lines were generated. (B). Representative images of primary cells four passages after isolation. White arrows indicate epithelial islands which were detectable only in the KPC Pr Sof cell line. Scale bars = 100 μm. (C,D). Flow cytometry analysis of CD44, CD24 and CD133 expression in pancreatic primary tumor and metastatic cell lines. 50,000 cells per cell line were analyzed. CD44 versus CD24 expression is shown after gates were set on the negative control (C) or on the single-stained CD24 control (D). (E,F). Protein immunoblotting for the indicated antibodies on cells isolated from primary KPC tumors (Pr Sof and Pr Sol) and metastatic lesions from liver (Li) and spleen (Sp) with or without a 5-min stimulation with EGF (10 ng/μL)prior to protein isolation. GAPDH blotting represented a loading control on the replicate blots used in this figure. Samples were run on replicate blots that were probed with different antibodies. Two different GAPDH loading control blots were therefore conducted.

