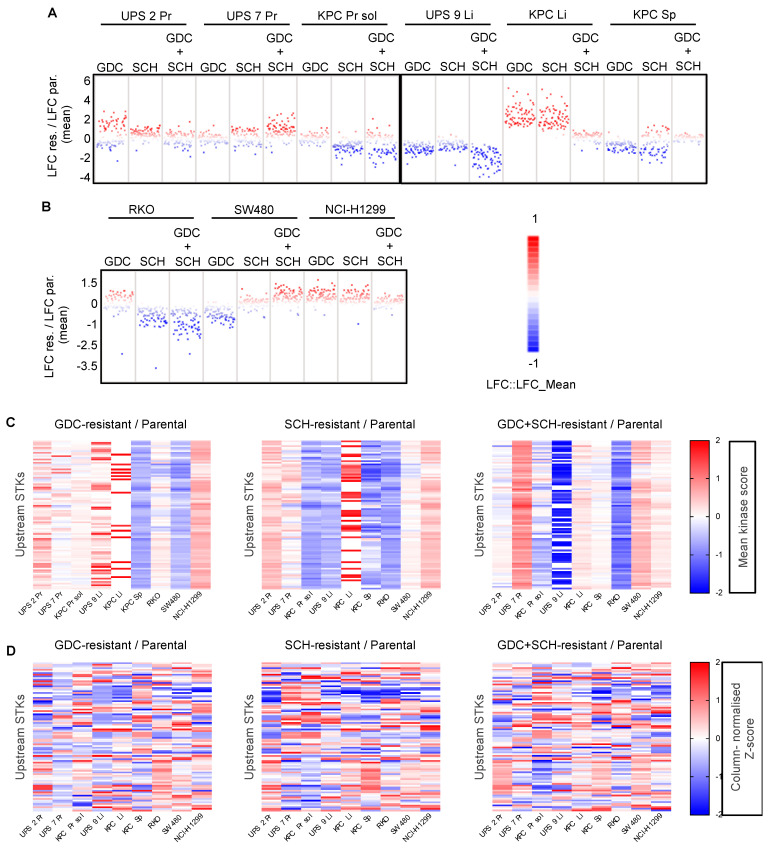
Figure 7.
Patterns of STK activity in resistant cells. (A,B). Log2 Fold Change (LFC) distribution of upstream STK kinase activity scores in resistant cell lines relative to their parental untreated counterpart in mouse (A) and human (B) cell lines. (C). Heatmaps depicting ratios of upstream kinase activity scores of resistant relative to parental cells organized by kinases on the Y-axis. (D). Heatmaps of column-normalized Z-scores based on upstream kinase activity scores of resistant relative to parental cells organized by kinases on the Y-axis. The Z-score acts as an intra-sample normalization to highlight relative differences in the activity of individual kinases compared to all kinases within the sample.

