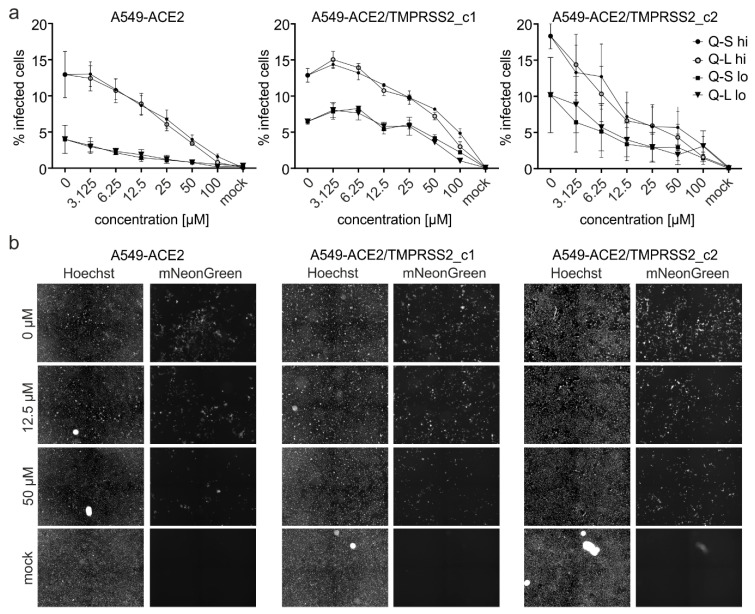
Figure 6.
Influence of Q-S, Q-L on SARS-CoV-2-mNG infection in ACE2 and TMPRSS2-expressing A549 cells. A549-stably transduced to express ACE2, ACE2/TMPRSS2 clone 1, and ACE2/TMPRSS2 clone 2 were infected with SARS-CoV-2-mNG at high and low MOIs (see M&M) for 1 h or mock-infected. Then the inoculum was removed, and the cells were treated with the indicated amounts of Q-S and Q-L. At 48 hpi, cells were fixed with 2% PFA and nuclei were stained with 1 µg/mL Hoechst. (a) The total amount of cells (Hoechst+) and infected cells (mNeonGreen+) were analyzed by automated microscopy to calculate the absolute % of infected cells. Mean values and SEM are calculated from three independent experiments. (b) Representative fluorescence microscopy images (4-fold magnification) of high titer infection of the respective cell line treated with the indicated amounts of Q-L.

