Figure 5.
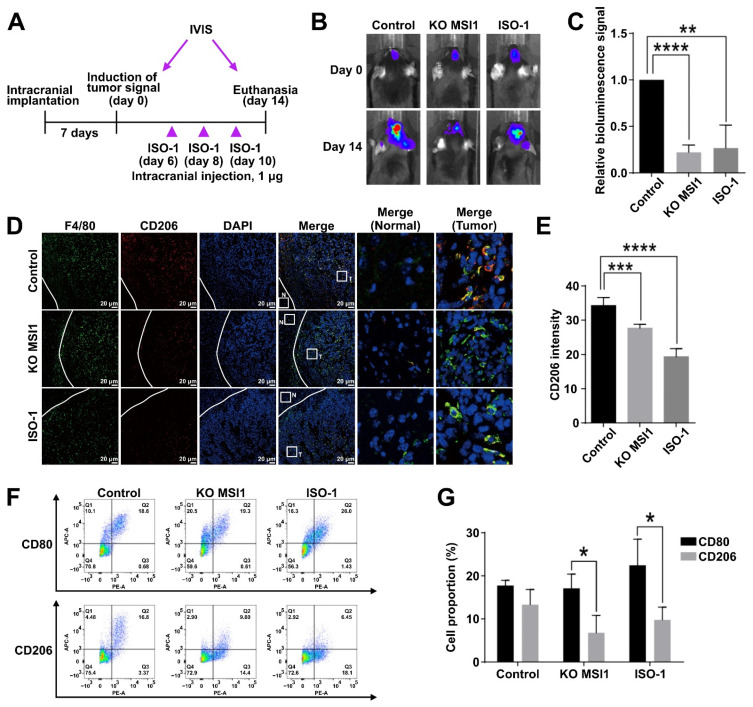
Inhibition of MIF1 causes suppression of GBM growth in vivo with concomitant reduction of the M2 macrophage population. (A) Schematic of the experimental design to test the effect of ISO-1 on intracranial tumor growth. GL261-Luc cells were intracranially implanted in mice (n = 3) and inoculated for seven days until the signal of tumor induction was observed by the IVIS luciferase imaging system (defined as day 0). The MIF-1 inhibitor ISO-1 (1 μg) was intracranially injected at days 6, 8 and 10. The signals of intracranial tumors were monitored by the IVIS luciferase imaging system till day 14 when the mice were sacrificed. (B) Bioluminescent imaging visualization (IVIS) of the indicated GL261-Luc-derived tumors. (C) Quantification of the bioluminescence signal from tumors in (B). Means with SD error bars are shown, n = 3, ** p < 0.01, **** p < 0.0001 (Student’s t-test). (D) Immunofluorescent staining of F4/80 (general macrophage marker) and CD206 (M2 marker) in the cross-sections of the indicated GL261-Luc-derived intracranial tumors. Tumor (T) and surrounding normal (N) tissue are marked by white squares and zoomed in the right panel. (E) Quantification of the CD206 immunofluorescent signal intensity in (D). Means are shown with SD error bars, n = 3, *** p < 0.005, **** p < 0.0001 (Student’s t-test). (F) Flow cytometry analysis of the proportion of CD80 (M1)- and CD206 (M2)-expressing macrophages in the indicated GL261-Luc-derived intracranial tumors. (G) Quantification of the proportion of CD80- and CD206-expressing macrophages in (F). Mean values are shown with SD error bars, n = 3, * p < 0.05 (Student’s t-test).

