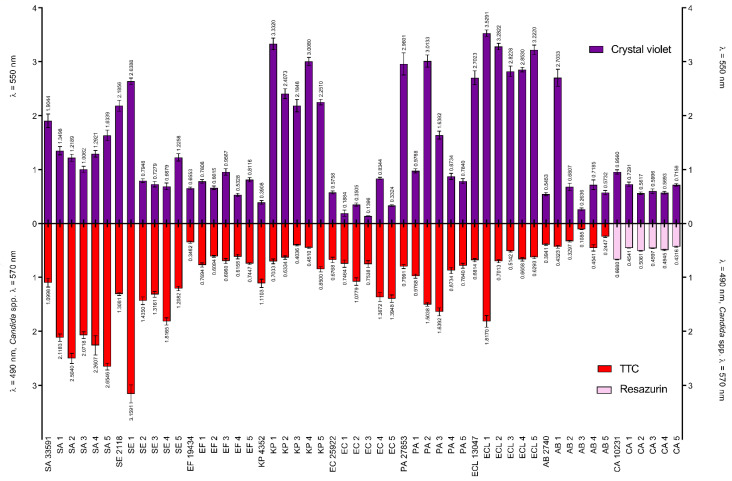
Figure 4.
Comparison of metabolic activity of cells in the biofilm to total biofilm mass of the analyzed strains. The amount of formed biofilm was measured using crystal violet (λ = 550 nm), and biofilm metabolic activity was measured with 2, 3, 5- triphenyl tetrazolium chloride (TTC, λ = 490 nm), and with resazurin (λ = 570 nm, only Candida spp.). Tested strains: SA—Staphylococcus aureus, SE—Staphylococcus epidermidis, EF—Enterococcus faecium, KP—Klebsiella pneumoniae, EC—Escherichia coli, PA—Pseudomonas aeruginosa, ECL—Enterobacter cloacae, AB—Acinetobacter baumannii, CA—Candida albicans.

