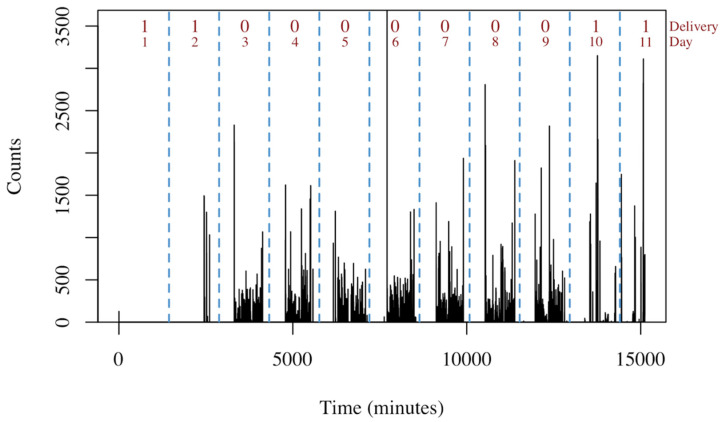
Figure 1.
Example of accelerometry data for an assessment. The black lines represent the measurements on the x-axis with a one-minute epoch. Vertical dashed blue lines indicate midnight. The ‘Delivery’ label indicates 0 for a human wear day and 1 for a delivery day. The red text enumerates the day of the assessment.

