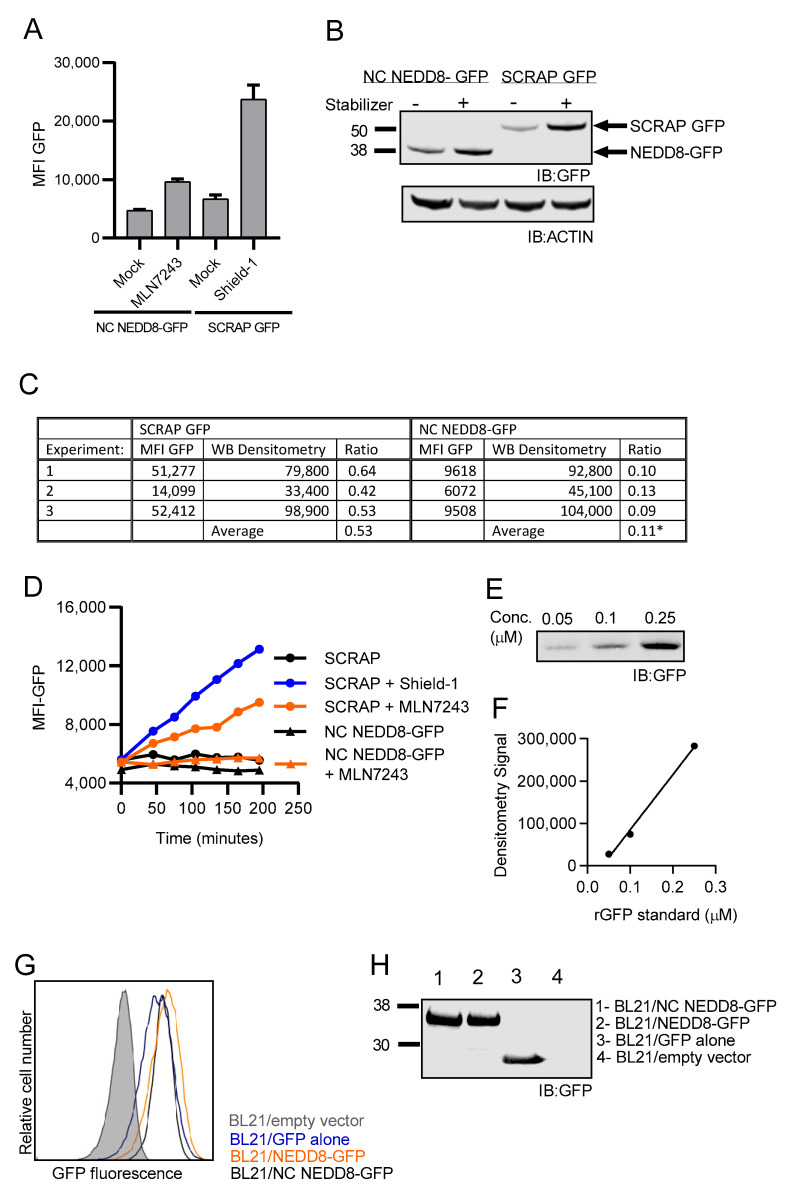
Figure 6.
Fusion of NEDD8 to GFP prevents proper folding of GFP. (A) GFP fluorescence as determined by flow cytometry in EL4/NC NEDD8-GFP cells and EL4/SCRAP-GFP cells after treatment with chemical stabilizer (Shield-1 or MLN7243 respectively) for 3 h is shown. The average MFI of the cellular population from three independent measurements is reported on the y-axis. (B) Western blot analysis for GFP accumulation after treatment of EL4/NC NEDD8-GFP and EL4/SCRAP-GFP cells with their stabilizers, Shield-1 or MLN7243, respectively, for 3 h. (C) The ratio of fluorescent GFP signal obtained by flow cytometry (MFI GFP) to total GFP protein obtained by Western blot (WB Densitometry) for both SCRAP-GFP and NC NEDD8-GFP after treatment with stabilizer was calculated for three independent experiments and was statistically different (* p < 0.05). (D) Comparison of increased fluorescence of EL4/SCRAP-GFP cells and EL4/NC NEDD8-GFP cells after stabilizer treatment. Mean GFP fluorescence intensity of EL4/SCRAP-GFP cells (black circle), EL4/SCRAP-GFP cells treated with Shield-1 (blue circle) or MLN7243 (orange circle), and EL4/NC NEDD8-GFP (black triangle) and EL4/NC NEDD8-GFP treated with MLN7243 (orange triangle) were measured by flow cytometry at the indicated time points. (E) Representative Western blot of GFP standards with the concentration of recombinant GFP standard indicated. (F) Standard curve for the Western blot shown, (E) demonstrating the linearity of the signal determined by densitometry. (G) GFP fluorescence of E. coli expressing NC NEDD8-GFP (black trace), NEDD8-GFP (orange trace), GFP (blue trace), or empty cloning vector (shaded histogram) as determined by flow cytometry. (H) Western blot for GFP from the indicated cell lysates of E. coli from part (G) above. All Western blot images were cropped to show relevant bands.

