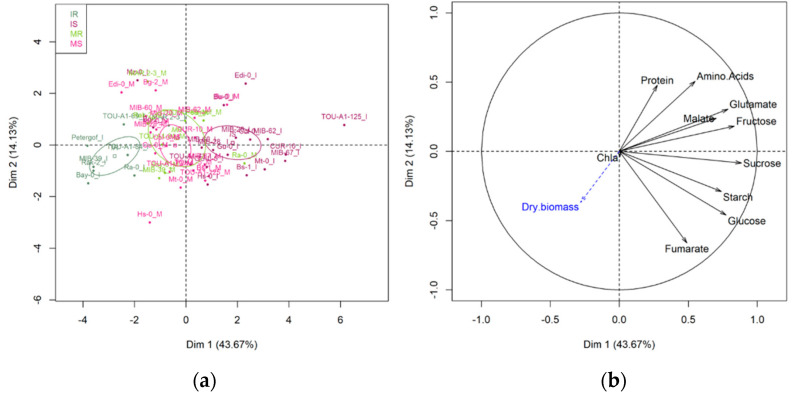
Figure 3.
Principal component analysis (PCA) performed on 26 A. thaliana accessions with 10 primary metabolic traits measured at 13 dai on mock-inoculated plants and TuMV-inoculated plants in the ‘2015’ field experiment. (a) Score plot of individuals. Score plots of resistant accessions are in green, light green for mock-inoculated, dark green for TuMV-inoculated. Score plots of susceptible accessions are in pink, light pink for mock-inoculated, dark pink for TuMV-inoculated. The confidence ellipses around the centroid of individuals are represented. (b) Variable correlation graph. Dry biomass was considered as explanatory traits (in blue on the variable factor map). Chla = Chlorophyll a.

