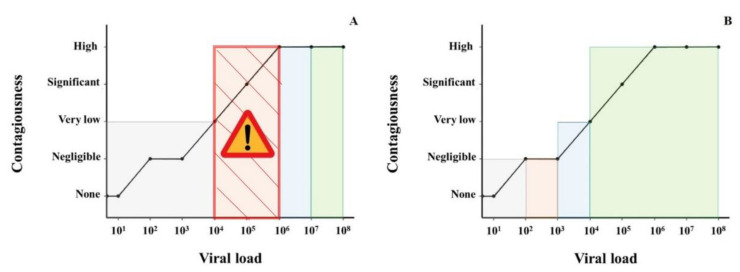
Figure 6.
Relationship between viral load, hypothetical contagiousness and correspondence with the sensitivity of (A) RAT and (B) RT-PCR (based on our evaluation).Viral load (VL) on the x-axis is expressed in a logarithmic (log10) scale. The gray area represents a test sensitivity of <20%. The orange area represents a sensitivity of >20% but lower than 80%. The blue area represents a sensitivity of >80% but <95%. The green area represents a sensitivity above 95%. (A) The “Attention” symbol highlights the orange dashed critical zone where SARS-CoV-2 is already contagious but the sensitivity of the RAT is not acceptable, being very low (30–60%) for VL between 104 and 105 and low (60–80%) for VL between 105 and 106.Contagiousness is estimated to be negligible when R0 < 0.01, very low when R0 > 0.01 and <0.05, significant when R0 > 0.05 and < 0.2 and high when R0 > 0.2 over a 24 h period in the same room than another patient.

