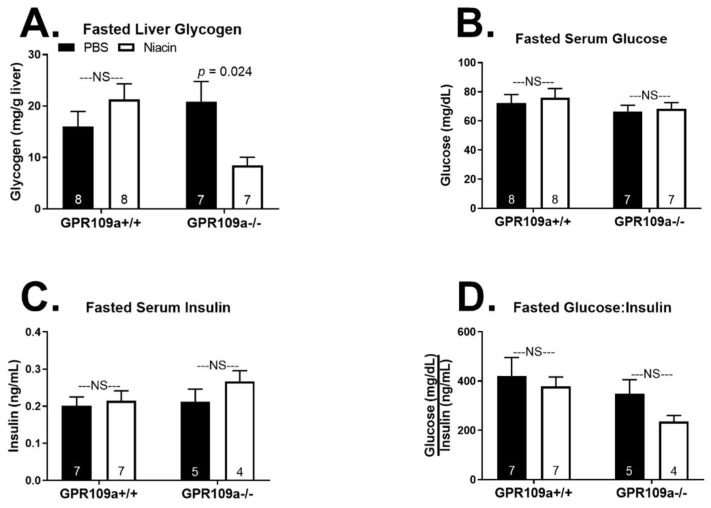
Figure 4.
Effect of niacin on glucose homeostasis in 16 h fasted GPR109a +/+ and −/− mice. Hepatic (A) glycogen (mg/g liver tissue), serum (B) glucose (mg/dL), (C) insulin (ng/mL), and (D) glucose:insulin ratio. Direct comparisons were made between injection treatment within genotype. NS = non-significant; p > 0.05; PBS = phosphate buffered saline. Numbers inside bars denote the n per group.

