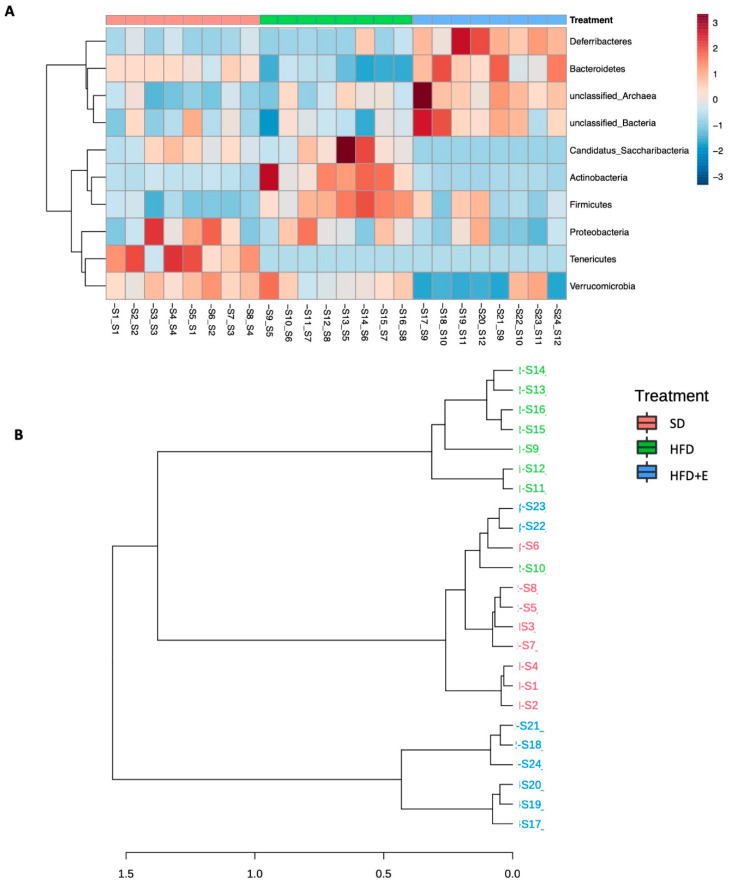
Figure 7.
Microbial communities cluster analyses. Heatmap of variance was obtained by grouping the reads according to the observed taxa to evaluate abundance patterns. A clear cluster was obtained between the three groups at phylum level (A). This separation is observed also in the dendrogram analyses (B).

