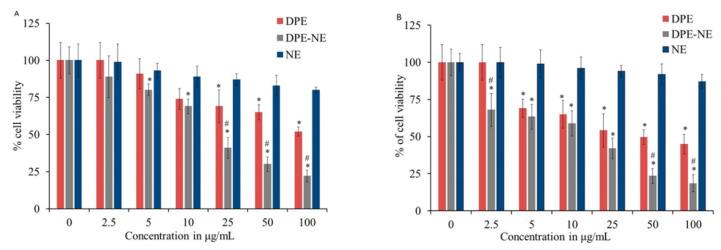
Figure 10.
Cell viability evaluation of free DPE, optimized PEGylated DPE, and blank NE against (A) MCF-7 and (B) HepG2 cell lines following 48 h incubation. Results are stated as the mean ± S.D * Statistically significant with blank NE (p < 0.05). # Statistically significant with free drug (DPE) (p < 0.05).

