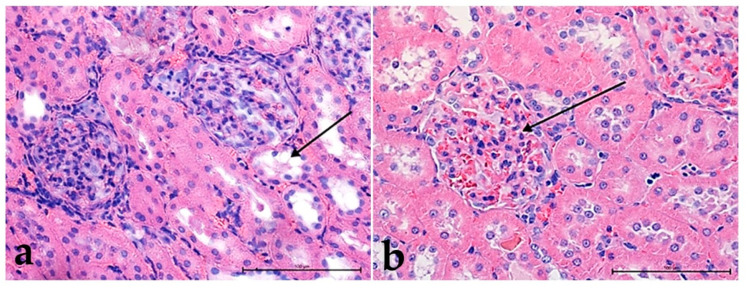
Figure 1.
The structure of the kidneys in the control groups: in normal, I (a) and high-cholesterol diet, II (b); (a) note the lack of the urine in proximal tubules and slightly enlarged distal tubules (black arrow); (b) glomerulus filled with blood (black arrow) hematoxylin and eosin (H&E) staining. Mag. 400×. Bar scale 100 µm.

