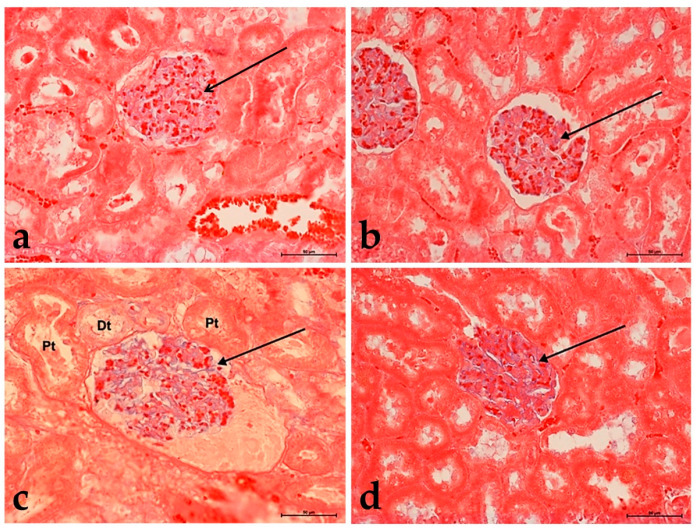
Figure 5.
The changes in the structure of the kidneys in animals fed with a normal diet—groups II (a), III (c), and in animals fed with high-cholesterol diet—groups IIa (b), IIIa (d). A glomerulus with different proteoglycan content (arrow). Note the presence of urine in the glomerulus in group III (c). Alcian blue staining. Mag. 200×. Bar scale 50 µm.

