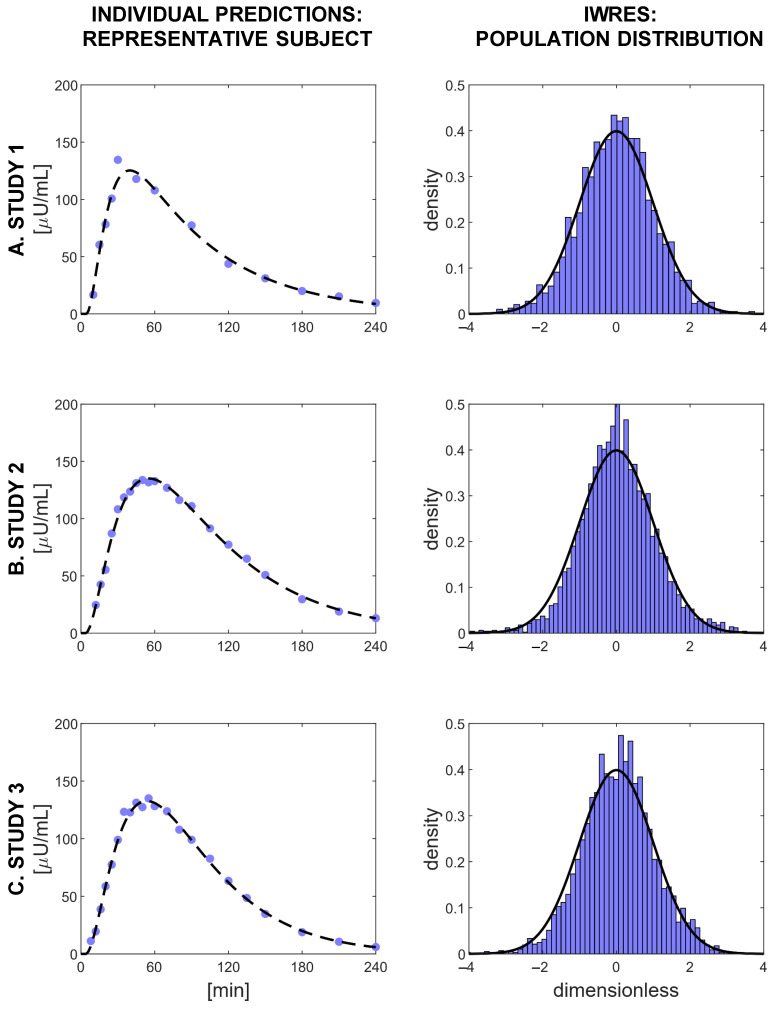
Figure 4.
Evaluation of the goodness of the predictions of Model 11. Left panels: the fit of the model for three representative subjects, one for each study. Blue dots indicate plasma insulin measurements, and black dashed lines represent the model predictions. Right panels: the distributions of the IWRES in each study, compared with a standard Gaussian distribution (black line).

