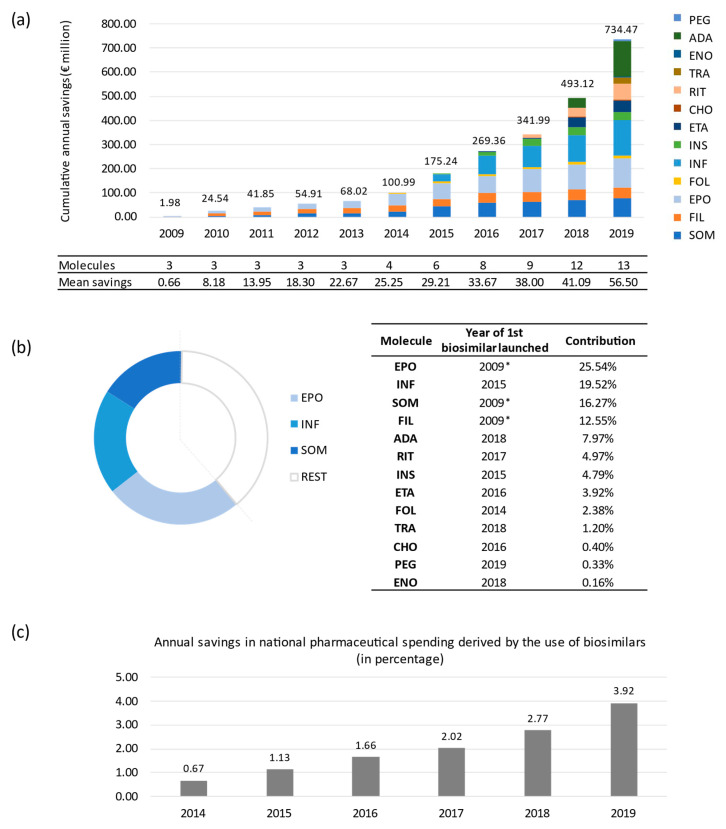
Figure 2.
Distribution of aggregate savings. (a) Aggregate savings over time. All molecules exposed to biosimilar competition each year were included in the analysis.; (b) Specific contribution of each of the molecules to the total amount of savings. SOM: somatropin; FIL: filgrastim; EPO: epoetin; FOL: follitropin alfa; INF: infliximab; INS: insuline glargine; ETA: etanercept; CHO: chondroitin sulfate; RIT: rituximab; TRA: trastuzumab; ENO: sodium enoxaparin; ADA: adalimumab; PEG: pegfilgrastim. * Biosimilars marketed before 2009: somatropin, 2006; filgrastim and epoetin, 2008 (2009 is the first year with available consumption data). (c) Annual savings derived from the use of biosimilars, in percentages, since 2014 with respect to total pharmaceutical spending in Spain. Total pharmaceutical spending calculated by adding hospital pharmaceutical spending and spending on pharmaceuticals and medical devices per prescription, all calculated at ex-factory prices [34].

