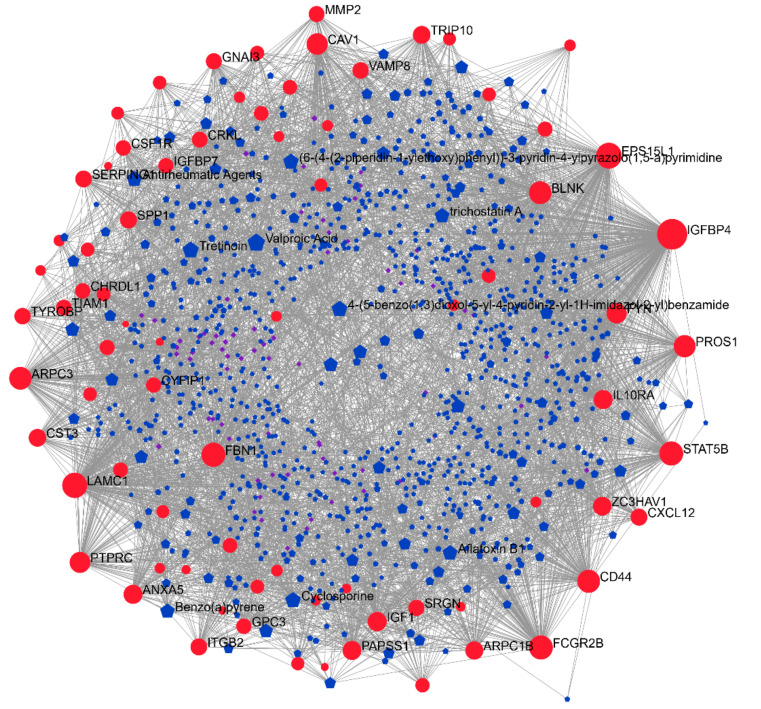
Figure 3.
Network analysis of the drug–gene interactome. A network-based approach, based on the DrugBank and CTD databases, was applied for the prediction of drugs potentially repurposable for DMD. Red nodes represent genes belonging to the DMD signature, blue nodes represent drugs from the DrugBank database, and violet nodes represent chemicals from the CTD database.

