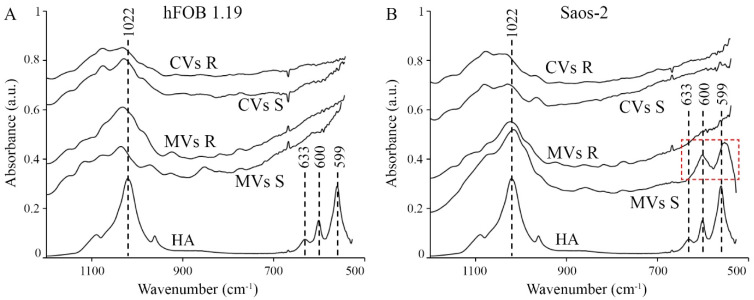
Figure 3.
IR spectra of minerals formed by vesicular fractions of hFOB 1.19 (A) and Saos-2 (B) cells. Vesicular fractions were purified from the extracellular matrix (MVs) and from the cytoplasm (CVs) of collagenase-treated cells in resting conditions (R) or after stimulation with AA and β-GP (S). The vesicular fractions were dried. IR spectrum of apatite (HA) is characterized by peaks 1022, 633, 600, and 559 cm−1. The red rectangle indicates the presence of HA in the fraction of MVs derived from the Saos-2 cell line stimulated for mineralization. IR spectra were averaged from three independent samples, each measured at two distinct locations of the batch (n = 6). IR spectra were up scaled by 0.2 A to be better visible.

