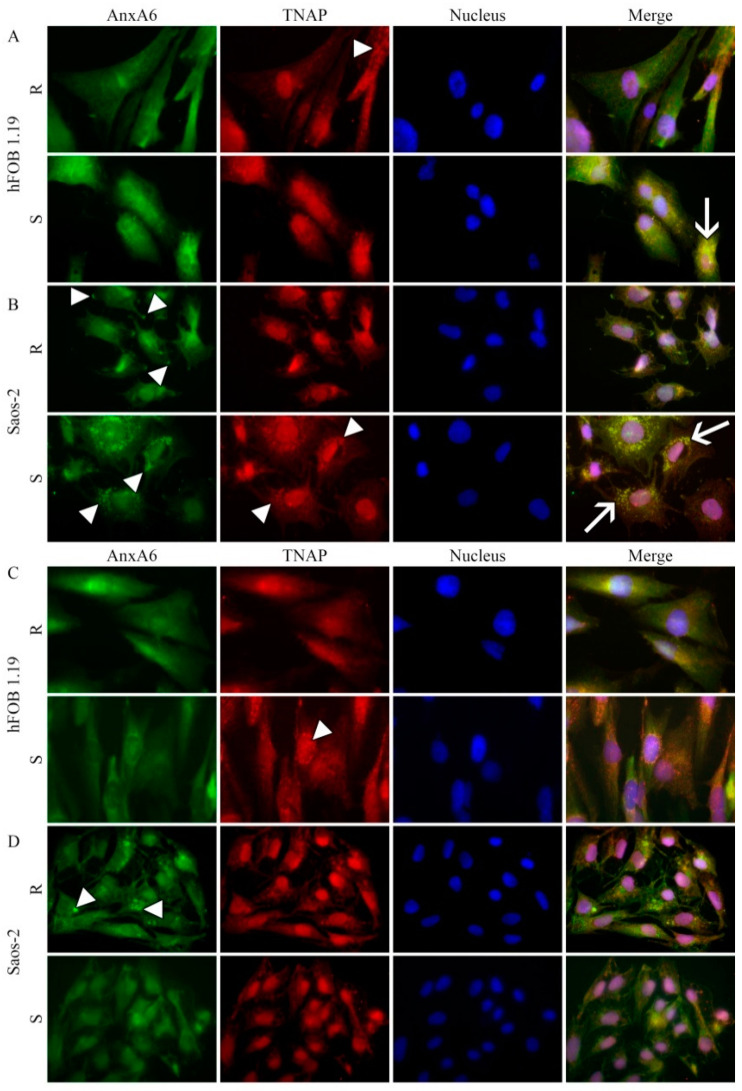
Figure 5.
Co-localization of AnxA6 with TNAP in hFOB 1.19 (A,C) and Saos-2 (B,D) cells after treatment with 100 μM levamisole (A,B) or 25 μM K201 (C,D) in resting conditions (R) or after seven-day stimulation with AA and β-GP (S). The cells were incubated with appropriate antibodies: mouse monoclonal anti-AnxA6 followed by goat anti-mouse IgG-FITC (green), rabbit polyclonal anti-TNAP followed by goat anti-rabbit IgG-TRITC (red) and DAPI for nucleus (blue) and observed under an Axio Observer.Z1 FM (Carl Zeiss, Poznan, Poland) with Phase contrast and appropriate fluorescent filters, magnification at 630×. Arrowheads indicate protein accumulation in vesicular and/or cluster structures. The yellow color and arrows on the merge images indicate AnxA6 co-localization with TNAP. Results of a typical experiment are presented.

