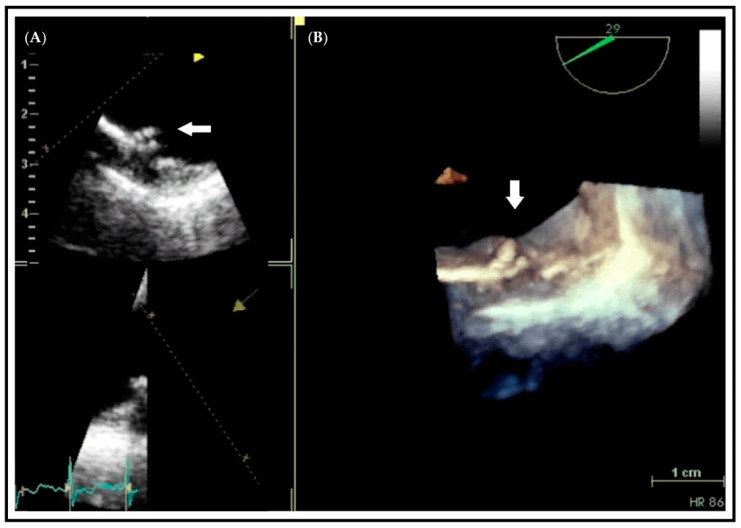
Figure 3.
Transesophageal echocardiographic study of a protruding plaque in the descending aorta (arrow). Differences in the visual assessment of aortic atherosclerotic plaque between a 2D-based image (A) compared with the 3D-based image (B). The entire contour of the complex plaque is seen in the 3D image.

