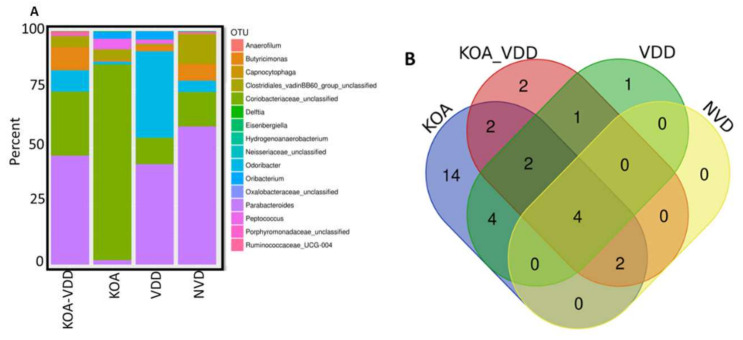
Figure 1.
Gut microbiome profile: (A) Operational Taxonomic Units (OTU) abundance was determined in stool samples collected across 4 study groups depicted in the bar chart; (B) Venn diagram with filtered OTUs excluding counts less than 50 OTUs; (C) canonical correspondence analysis (CCA) was performed to study the beta diversity between stool microbiome in Knee osteoarthritis (KOA)_vitamin D deficiency (VDD), KOA, VDD and Normal Participants.


