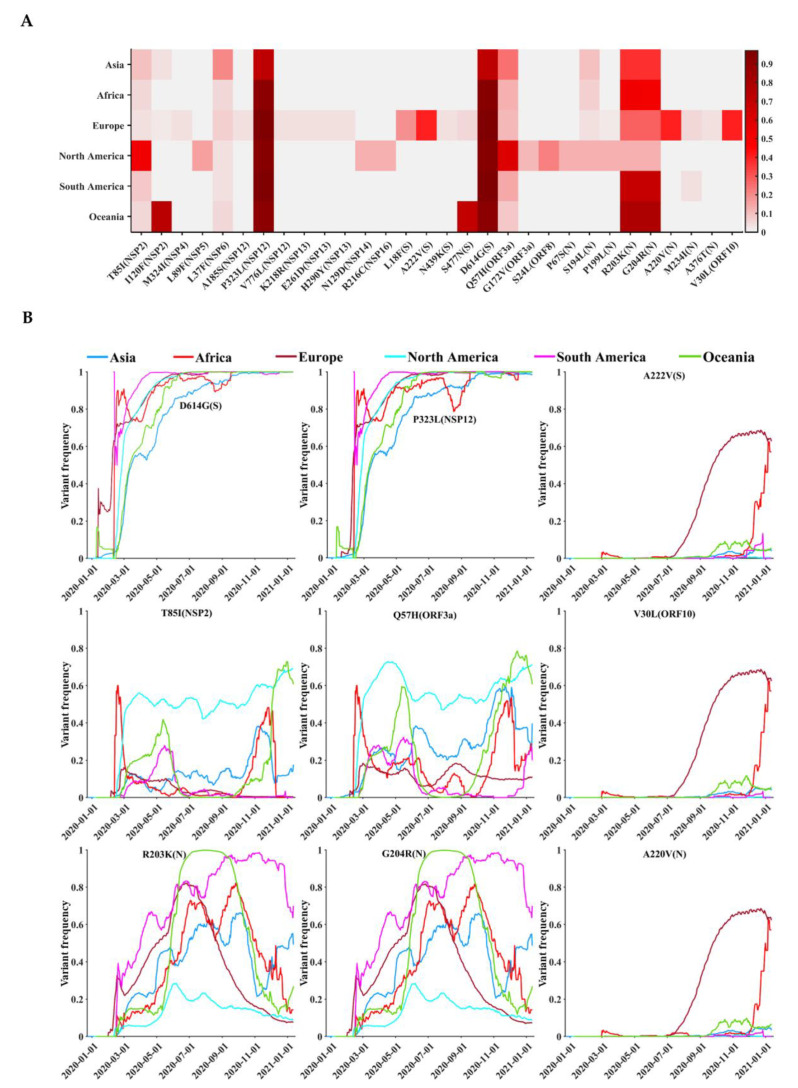
Figure 4.
Distribution of frequent variants across the SARS-CoV-2 proteins in different geographic areas. (A) Frequencies of the top 30 variants, with the highest variant frequencies in different continents. (B) Temporal and geographic dynamics of frequent SARS-CoV-2 variants. The vertical axis represents the moving-window variant frequency calculated by dividing the number of sequences containing a specific variant, 15 days before and after a specific date, by the total number of sequences in the period (31 days).

