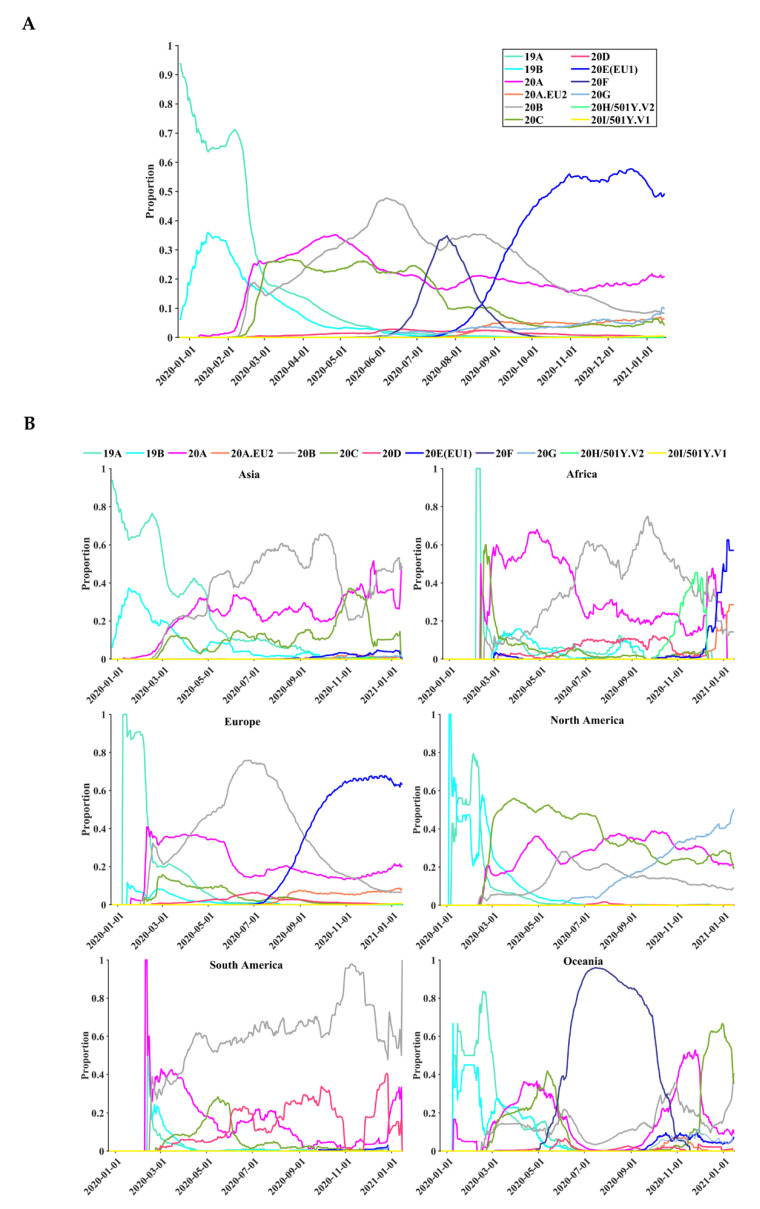
Figure 7.
Temporal distributions of the 12 clades based on 260,673 complete SARS-CoV-2 nucleotide sequences. (A) The global distribution of the 12 clades over time. (B) The distribution of the 12 clades over time on six continents. The vertical axis represents the moving-window proportion, calculated by dividing the number of sequences belonging to a specific clade, 15 days before and after a specific date, by the total number of sequences in the period (31 days).

