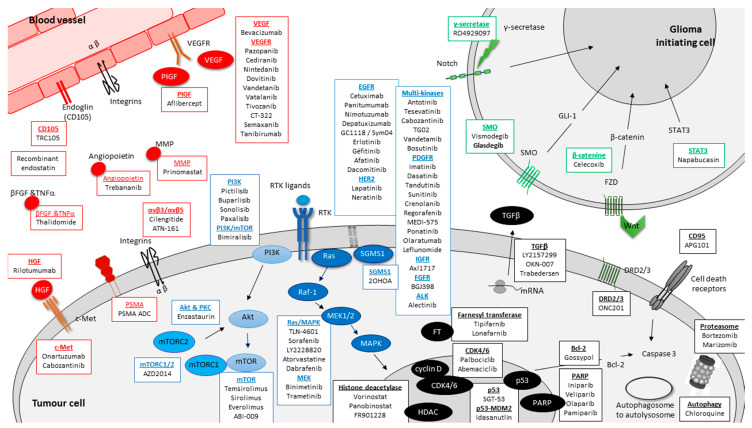
Figure 3.
Principal biomarkers and drugs in GBM targeted therapies. The color code corresponds to the four sections of the Results section. The targeting of stem cells and stem cell pathways is represented in green, the targeting of growth autonomy and migration in blue, the targeting of the cell cycle & escape to cell death in black and the targeting of angiogenesis in red. Acronyms are defined in the text.

