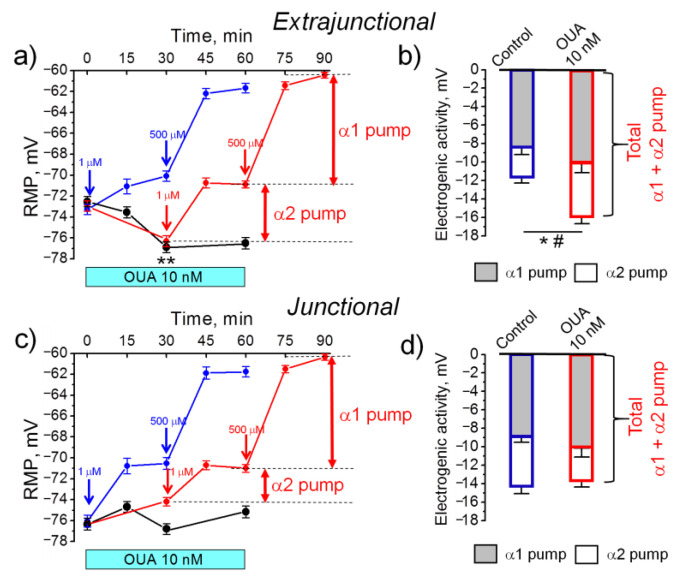
Figure 1.
The effect of 10 nM ouabain on resting membrane potential (RMP) and electrogenic contribution of the α1 and α2 Na,K-ATPase in the sarcolemma of rat soleus muscles. The measurements were done in the (a,b) extrajunctional and (c,d) junctional regions of sarcolemma. (a,c) Black circles and lines show the RMP changes upon 10 nM ouabain incubation in bath solution at different time-points over 60 min experiment, as indicated. Red circles and lines show the RMP changes when bath ouabain concentration was increased from 10 nM to 1 µM and 500 µM (indicated by corresponding arrows) to estimate the electrogenic contribution of the α1 and α2 Na,K-ATPase (see also the Methods). Blue circles and lines demonstrate control measurements without pre-incubation with 10 nM ouabain, where the electrogenic contribution of the α1 and α2 Na,K-ATPase was estimated as above. (b,d) The estimated electrogenic contribution of the α1 and α2 Na,K-ATPase under control conditions and in the presence of 10 nM ouabain is shown in (a) and (c). Each data point is a mean value of membrane potentials measured in at least 100 fibers of 6–8 soleus muscles from 3–4 rats. One-way ANOVA. (a) ** p < 0.01—RMP compared to the corresponding initial value. (b) * p < 0.05—the α2 Na,K-ATPase contribution and # p < 0.05—total α1 and α2 Na,K-ATPase contribution compared with the control conditions.

