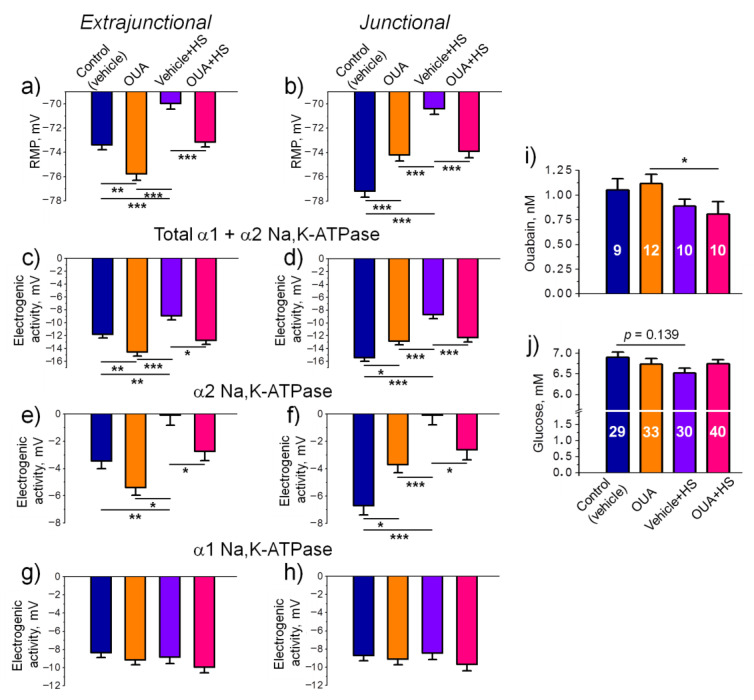
Figure 3.
Changes in the electrogenesis of soleus muscles after 4-days pre-treatment with ouabain (1 μg/kg) followed by rat hindlimb suspension (HS) for 6 h. (a,b) Resting membrane potential (RMP). (c,d) Total electrogenic activity contributed by the α1 and α2 isozymes of Na,K-ATPase. (e,f) Electrogenic activity of the α2 isozyme of Na,K-ATPase. (g,h) Electrogenic activity of the α1 isozyme of Na,K-ATPase. The measurements in (a–g) extrajunctional and (b–h) junctional regions of the membrane, as indicated. (i,j) Serum level of ouabain and glucose, respectively (the number of rats is shown in the bars). Control and ouabain-treated (OUA) groups are represented by the rats, which received injections of vehicle (0.9% NaCl) or ouabain for 4 days, respectively. HS group contains the rats injected by 0.9% NaCl followed by HS for 6 h. OUA + HS group is a group of ouabain-injected rats that were exposed for the following 6-h HS. Each value is a result of measuring the RMP in at least 100 muscle fibers of 6–10 muscles from 3–5 rats. There was a significant interaction between HS and OUA effects for (b) p < 0.0001; F (1.614) = 42.15; (d) p < 0.0001; F (1.596) = 24.64 and (f) p < 0.0001; F (1.596) = 16.97. Two-way ANOVA followed by Tukey’s multiple comparisons test. * p < 0.05, ** p < 0.01, *** p < 0.001—compared as indicated by horizontal bars.

