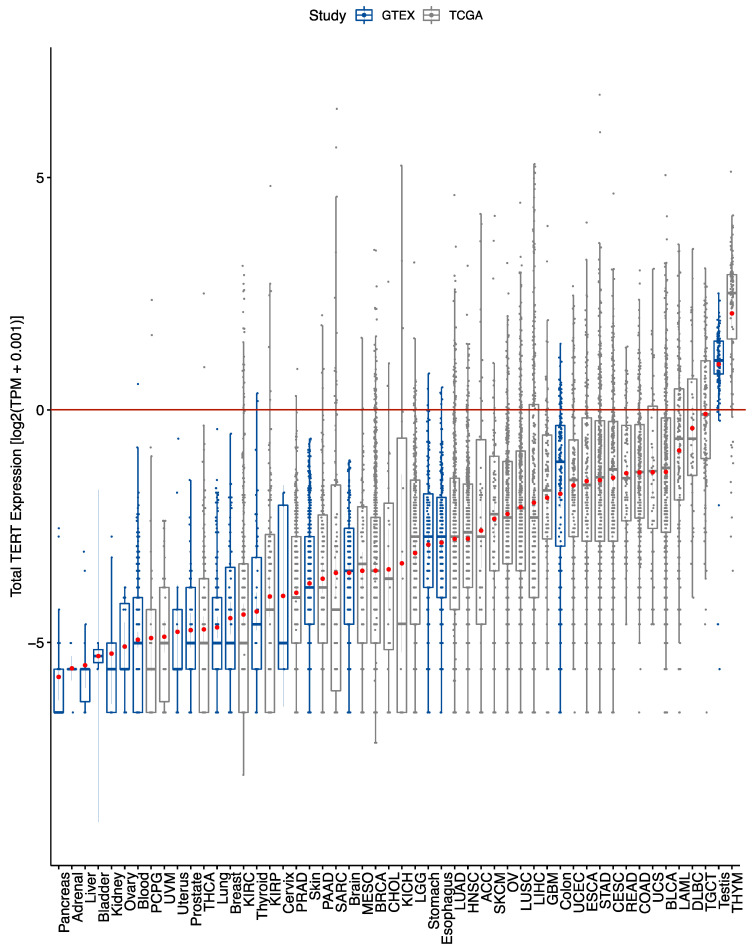
Figure 2.
Variable total TERT expression observed across tumour and normal tissue types. Total TERT expression across TCGA tumours shows tumour-specific expression. Total TERT expression across GTEx normal tissue types shows the majority have low expression except for gastrointestinal and testicular tissue types. Box plots boxes denote the inter-quartile range as well as a bolded line representing the median. Extending from the boxes are minimum and maximum lines calculated from 1.5 times the interquartile range. Points outside this range are considered outliers. Within each box is a red point signifying the mean, as well as lines extending from this point representing a 95% confidence interval. Expression values in transcript per million (TPM) were transformed by a log2(TPM + 0.001) equation. Horizontal line at y = 0 indicates 1 TPM.

