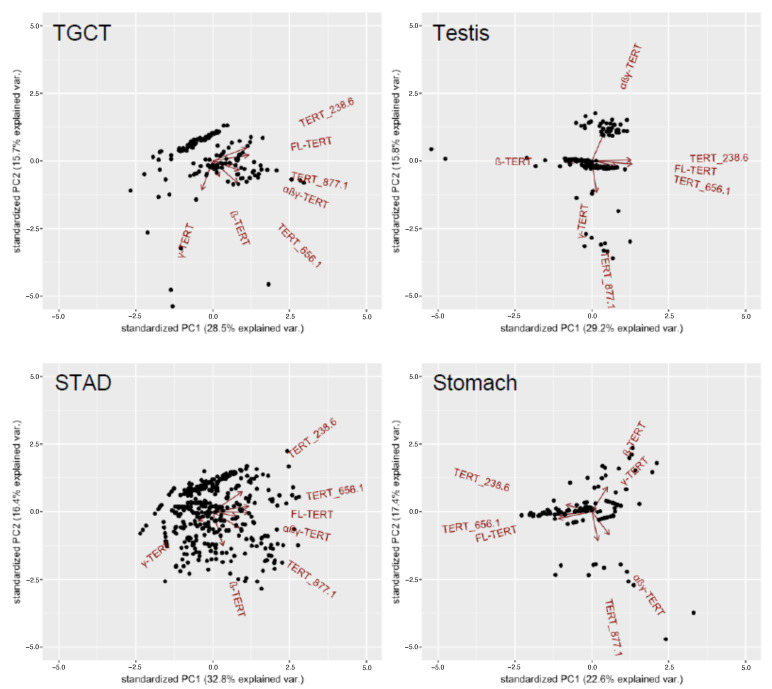
Figure 3.
Expression relationships between TERT isoforms differ between tissue types and when in the neoplastic state. PCA biplots for testicular germ cell tumours (TGCT), stomach adenocarcinoma (STAD), and their respective matched normal tissues are shown as examples. Plotted using the first two principal components and show the loading vectors (arrows) of each TERT isoform variable expressed. The arrow length approximates the variance of the variable. The angle between arrows approximates the correlations between variables. Such that parallel arrows in the same direction have positive correlations, perpendicular arrows have no/weak correlations, and parallel arrows in the opposite direction have negative correlations.

