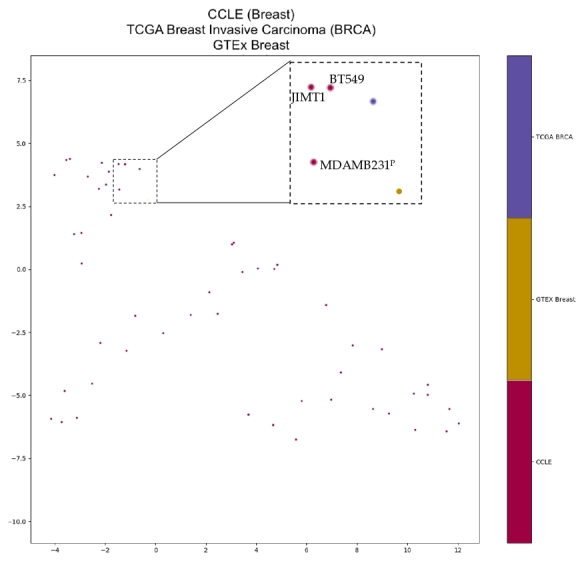
Figure 6.

UMAP projection of breast CCLE cell lines, TCGA breast invasive carcinoma (BRCA), and GTEx breast using TERT isoform expression. Cell lines JIMT1 and BT549 were closest to average isoform percentage from TCGA BRCA. Cell line MDAMB231 was closest to average isoform percentage from GTEx breast. Cell line TERT promoter status taken from Ghandi et al., 2019. Superscript “P” indicates TERT promoter mutation, superscript “WT” indicates wild-type TERT promoter, and no superscript indicates no data available. Dashed-line box indicates a zoomed in region of interest with text labels of cell lines. UMAP Parameters: Manhattan distance, 8 Neighbours and 4 Components.
