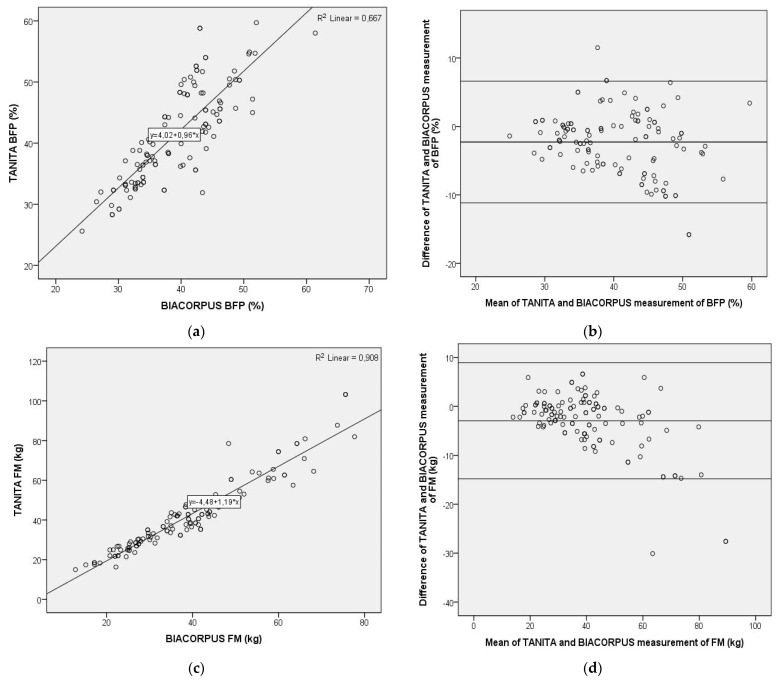
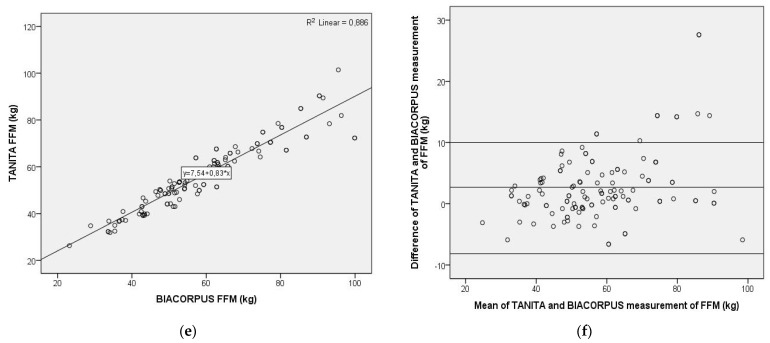
Figure 1.
Pearson correlation analysis and Bland–Altman plot of body composition data obtained with two bioelectrical impedance-based methods, TANITA (Type BC-418MA, TANITA Corporation, Tokyo, Japan) and BIACORPUS (BIACORPUS RX 4000, Medical Healthcare GmbH, Karlsruhe, Germany). Left panel: Pearson correlation for body fat percentage (a), fat mass (c), and fat free mass (e), with R2 and the equation of the best linear fit given for each correlation plot. Right panel: Bland–Altman plots for body fat percentage (b), fat mass (d), fat free mass (f), with the middle line indicating the mean difference and the upper- and lower-line representing limits of agreement. BFP = body fat percentage, FM = fat mass, FFM = fat-free mass.


