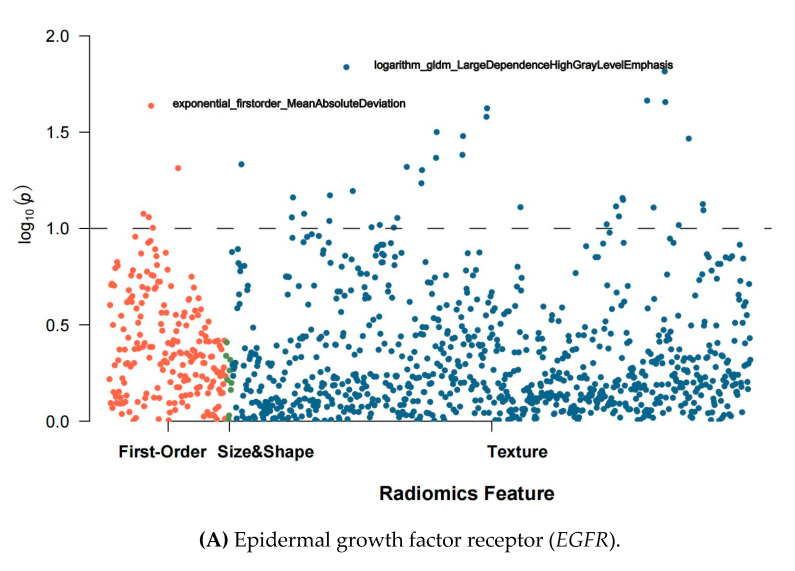
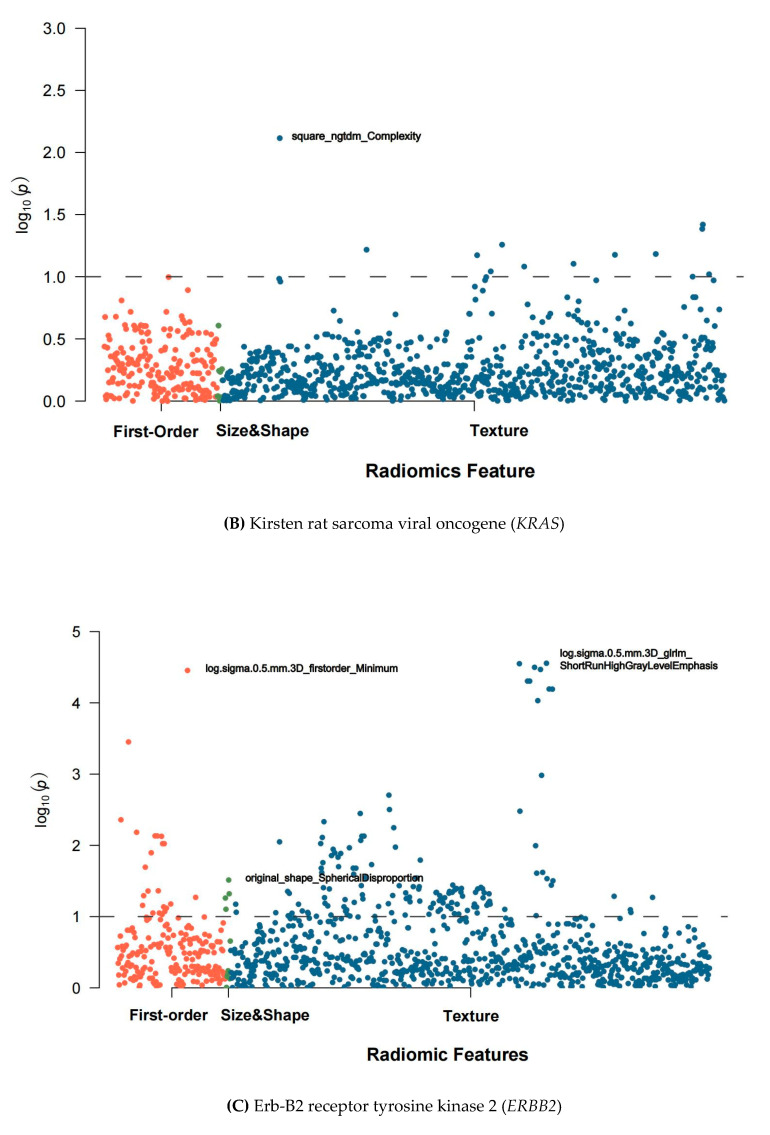
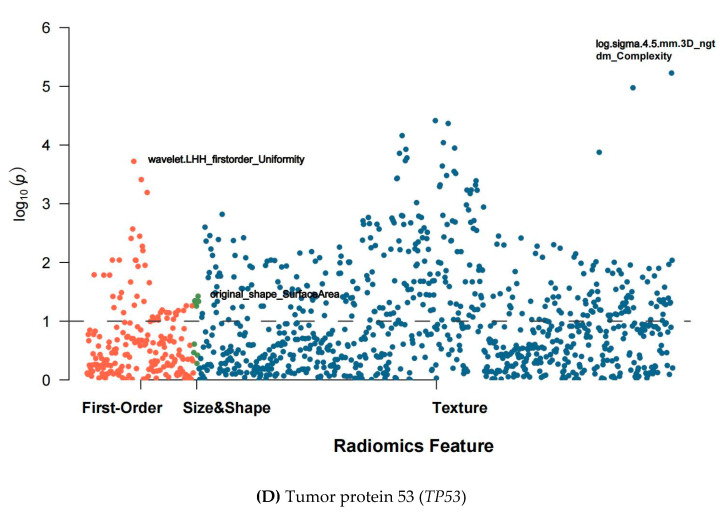
Figure 3.
Manhattan plots of feature selection. The orange, green, and blue dots represent first-order, size&shape, and texture features, respectively. The features above the dashed line are those with a Spearman’s rank correlation coefficient >0.8, which are considered eligible for building discriminative models.


