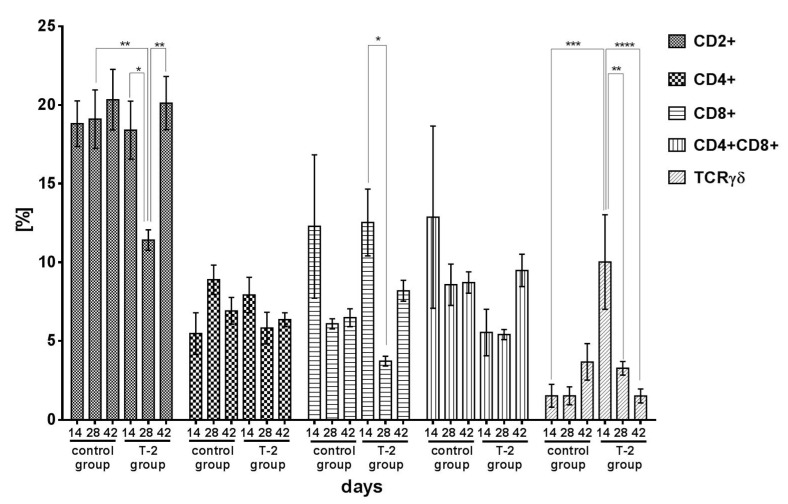
Figure 2.
Cytometric analysis of CD2+, CD4+, CD8+, CD4+CD8+, TCRγδ+ cells isolated from porcine ileal wall in the control group and group T-2 on days 14, 28, and 42 (pg/mg protein; n = 5 each). The results are presented as means ± SEM. Statistically significant differences were determined at * p < 0.05, ** p < 0.01, *** p < 0.001, and **** p < 0.0001.

